

LOADING....
Experimental Period
Aug 1, 2012-Feb 1, 2013
(Take Survey)
Click for product legends.
Aug 1, 2012-Feb 1, 2013
(Take Survey)
Click
for product legends.
River Information
Click location for AHPS hydrograph page

Last Updated: October 22 2012 06:15 UTC
Last Updated: October 22 2012 06:15 UTC
Observed Precipitation
Obs (Hourly)
Off
3-hour
6-hour
12-hour
24-hour
Last Updated: October 22 2012 05:48 UTC
3-hour
6-hour
12-hour
24-hour
Last Updated: October 22 2012 05:48 UTC
Obs (Daily)
Off
7-day
14-day
30-day
60-day
90-day
180-day
Month-to-date
Water Year-to-date
Year-to-date
Last Updated: October 21 2012 20:21 UTC
7-day
14-day
30-day
60-day
90-day
180-day
Month-to-date
Water Year-to-date
Year-to-date
Last Updated: October 21 2012 20:21 UTC
Normal (Daily)
Off
7-day
14-day
30-day
60-day
90-day
180-day
Month-to-date
Water Year-to-date
Year-to-date
Last Updated: October 21 2012 20:21 UTC
7-day
14-day
30-day
60-day
90-day
180-day
Month-to-date
Water Year-to-date
Year-to-date
Last Updated: October 21 2012 20:21 UTC
% Normal (Daily)
Off
7-day
14-day
30-day
60-day
90-day
180-day
Month-to-date
Water Year-to-date
Year-to-date
Last Updated: October 21 2012 20:22 UTC
7-day
14-day
30-day
60-day
90-day
180-day
Month-to-date
Water Year-to-date
Year-to-date
Last Updated: October 21 2012 20:22 UTC
Forecast Precipitation
Hydrologic Prediction Center
Day 1
12Z 10/22/12 - 12Z 10/23/12
Day 2
Day 3
00Z 10/24/12 - 00Z 10/25/12
Day 4-5
00Z 10/25/12 - 00Z 10/27/12
5 Day Total
00Z 10/22/12 - 00Z 10/27/12
WGRFC QPF
Day 1
12Z 10/22/12 - 12Z 10/23/12
Day 2
Day 3
00Z 10/24/12 - 00Z 10/25/12
Day 4-5
00Z 10/25/12 - 00Z 10/27/12
5 Day Total
00Z 10/22/12 - 00Z 10/27/12
WGRFC QPF
Current Conditions
Hydrology
Hazards
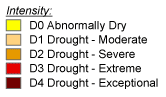
Drought Monitor
(USDA)
Valid: October 22 2012 06:30:02
Radar:
Latest Loop
Frames:
Satellite (Latest):
Infrared - East
Infrared - West
Visble - East
Visible - West
Hazards
Drought Monitor
(USDA)
Valid: October 22 2012 06:30:02
Radar:
Latest Loop
Frames:
Satellite (Latest):
Infrared - East
Infrared - West
Visble - East
Visible - West
Flood Guidance
Hydrologic Prediction Center:
Flood Outlook
Potential
Valid: OCT 13 - OCT 18
WGRFC FOP
Flash Flood Guidance (Latest):
1-hr FFG
3-hr FFG
6-hr FFG
12-hr FFG
24-hr FFG
Flood Outlook
Potential
Valid: OCT 13 - OCT 18
WGRFC FOP
Flash Flood Guidance (Latest):
1-hr FFG
3-hr FFG
6-hr FFG
12-hr FFG
24-hr FFG
Long-Range Outlooks
Climate Prediction Center Outlooks:
6-10 Day
Temperature(Temp)
Precipitation(Pcpn)
Valid: 10/15/2012 - 10/19/2012
8-14 Day
Temp Pcpn
Valid: 10/17/2012 - 10/23/2012
Monthly
Temp Pcpn
Valid: Oct 2012
Three Month
Temp Pcpn
Valid: OND- 2012
6-10 Day
Temperature(Temp)
Precipitation(Pcpn)
Valid: 10/15/2012 - 10/19/2012
8-14 Day
Temp Pcpn
Valid: 10/17/2012 - 10/23/2012
Monthly
Temp Pcpn
Valid: Oct 2012
Three Month
Temp Pcpn
Valid: OND- 2012
Local RFC Products
Severe Weather
Storm Prediction Center Outlooks:
Day 1
VALID FROM 221200Z-231200Z
Day 2
VALID FROM 231200Z-241200Z
Day 3
VALID FROM 231200Z-241200Z
Storm Reports (LSR)
Today
Yesterday
Day 1
VALID FROM 221200Z-231200Z
Day 2
VALID FROM 231200Z-241200Z
Day 3
VALID FROM 231200Z-241200Z
Storm Reports (LSR)
Today
Yesterday
Tropical
National Hurricane Center Products
120-hour Wind Probabilities:
34 Knots
50 Knots
64 Knots
50 Knots
64 Knots
Geographic Overlays
State
RFC Boundaries
River Basins
(HUC 4)
Major Rivers
Forecast
Watersheds
Counties
Roads/Cities
(Google)
Population Density
RFC Boundaries
River Basins
(HUC 4)
Major Rivers
Forecast
Watersheds
Counties
Roads/Cities
(Google)
Population Density
Partner Overlays
FEMA:
FEMA Regions
Hurricane
Evacuation
Routes
USGS:
Percent
Impervious
Surface (NLCD)
US Army Corps of Engineers:
Division Boundaries
District Boundaries
FEMA Regions
Hurricane
Evacuation
Routes
USGS:
Percent
Impervious
Surface (NLCD)
US Army Corps of Engineers:
Division Boundaries
District Boundaries


