|
Home >
Environment > Emission of Greenhouse Gases > Carbon Dioxide Emissions
|
Emissions of Greenhouse Gases Report
|
Full Printer-Friendly Version |
Carbon Dioxide Emissions
Total Emissions | Energy-Related Emissions | Carbon Capture and Storage: A Potential Option for Reducing Future Emissions |
Residential Sector | Commercial Sector | Industrial Sector | Transportation Sector | Electric Power Sector |
Nonfuel Uses of Energy Inputs | Adjustments to Energy Consumption | Other Sources |
|
|
Total Emissions |
|
|
 |
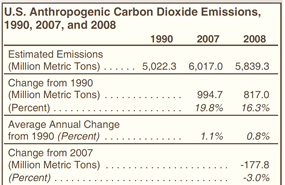
Total U.S. carbon dioxide emissions in 2008, compared with 2007 emissions
(Figure 7 on the right), fell by 177.8 million metric tons (MMT), or 3.0 percent, to
5,839.3 MMT. The decrease—the largest over the 18-year period beginning
with the 1990 baseline—puts 2008 emissions 47.1 MMT below the 2000 level.
|
|
The important factors that contributed to the decrease in carbon dioxide
emissions in 2008 included higher energy prices, especially during the summer
driving season, slowing economic growth, and a decrease in the carbon intensity
of energy supply. |
|
Energy-related carbon dioxide emissions account for 98 percent of U.S.
carbon dioxide emissions (Table 5 below). The vast majority of carbon dioxide
emissions come from fossil fuel combustion, with smaller amounts from the
nonfuel use of energy inputs, and the total adjusted for emissions from
U.S. Territories and international bunker fuels. Other sources include
emissions from industrial processes, such as cement and limestone production. |
|
|
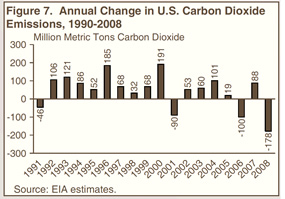
figure data
|
| Energy-Related Emissions |
|
|
|
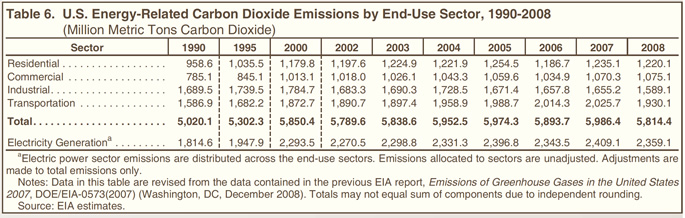
Energy-related carbon dioxide emissions account for more than 80 percent
of U.S. greenhouse gas emissions. EIA breaks energy use into four end-use
sectors (Table 6 below), and emissions from the electric power sector are attributed
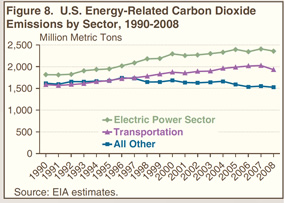
to the end-use sectors. Growth in energy-related carbon dioxide emissions
since 1990 has resulted largely from increases associated with electric
power generation and transportation fuel use. All other energy-related
carbon dioxide emissions (from direct fuel use in the residential, commercial,
and industrial sectors) have been either flat or declining in recent years
(Figure 8 on the right). In 2008, however, emissions from both electric power and transportation
fuel use were down—by 2.1 percent and 4.7 percent, respectively.
|
|
Reasons for the long-term growth in electric power and transportation sector
emissions include: increased demand for electricity for computers and electronics
in homes and offices; strong growth in demand for commercial lighting and
cooling; substitution of new electricity-intensive technologies, such as
electric arc furnaces for steelmaking, in the industrial sector; and increased
demand for transportation services as a result of relatively low fuel prices
and robust economic growth in the 1990s and early 2000s. Likewise, the
recent declines in emissions from both the transportation and electric
power sectors are tied to the economy, with people driving less and consuming
less electricity in 2008 than in 2007. |
|
Other U.S. energy-related carbon dioxide emissions have remained flat or
declined, for reasons that include increased efficiencies in heating technologies,
declining activity in older “smokestack” industries, and the growth of
less energy-intensive industries, such as computers and electronics. |
|
|
 |
| Carbon Capture and Storage: A Potential Option for Reducing Future Emissions |
|
|
The possibility of future constraints on greenhouse gas emissions has heightened
interest in carbon capture and storage (CCS) technologies as an option
to control CO2 emissions. The U.S. Department of Energy (DOE) has received
increased funding for the continued development of new CCS technologies,3 and as the scale and scope of CCS projects grow, it will be important for
EIA to track volumes of carbon stored, so that they can be subtracted appropriately
in greenhouse gas inventory estimates.
The United States emits about 1.9 billion metric tons of CO2 annually from
coal-fired power plants—33 percent of total energy-related CO2 emissions
and 81 percent of CO2 emissions from the U.S. electric power sector. Coal-fired
power plants are the most likely source of CO2 for storage; however, other
sources are possible.
CCS involves three steps: capture of CO2 from a fossil-fueled power plant
or other industrial process; transport of the compressed gas via pipeline
to a storage site; and injection and storage in a geologic formation.
CO2 Capture: There are three types of CO2 capture: post-combustion, pre-combustion,
and oxy-combustion. Post-combustion capture is a well-known technology,
which currently is used to a limited degree. It involves capture of CO2 from flue gases after a fossil fuel has been burned. Pre-combustion capture
involves gasifying the fossil fuel, instead of using direct combustion.
The CO2 can be captured readily from the gasification exhaust stream. For
oxy-combustion capture, coal is burned in pure oxygen instead of air, so
that the resulting exhaust contains only CO2 and water vapor. Systems that
use these technologies currently are being developed to capture at least
90 percent of emitted CO2.4
Pipeline Transportation: Captured CO2 emissions are transported most commonly
as highly pressurized gas through pipeline networks to storage sites. Currently,
more than 1,550 miles of pipeline transport some 48 MMT of CO2 per year
in the United States from natural and anthropogenic sources, mostly to
oil fields in Texas and New Mexico for enhanced oil recovery (EOR).5 As
is done for natural gas pipelines, fugitive emissions from the transport
of gaseous CO2 will need to be accounted for in EIA’s greenhouse gas inventories.6
Geological Storage: Three main types of geological formation—each with
varying capacities—currently are viewed as possible reservoirs for the
storage of captured CO2: oil and gas reservoirs, saline formations, and
unmineable coal seams (see figure on right).
Oil and Gas Reservoirs: Currently in the United States, about 48 MMT of
CO2 per year is injected into oil and gas fields for EOR.7 CO2 also may
be pumped into oil and gas reservoirs strictly for storage: as a result
of EOR operations, about 9 MMT of CO2 is stored per year.8 Storage capacity
for CO2 in depleted oil and gas fields in the United States and Canada
currently is estimated at 138 billion metric tons.9 Worldwide, CO2 storage capacity
in EOR projects and other depleted oil and gas fields is estimated at 675
to 1,200 billion metric tons.10
Saline Formations: A second type of geologic formation that could be used
to store CO2 is saline formations, which have an estimated worldwide storage
capacity of up to 20,000 billion metric tons.11 These formations have the
potential to trap CO2 in pore spaces, and many large point sources of CO2 emissions are relatively close to saline formations. The United States
and Canada have an estimated combined storage capacity of 3,300 to 12,600
billion metric tons in saline formations.12
Unmineable Coal Seams: When CO2 is injected into an unmineable coal seam,
it displaces methane and remains sequestered in the bed. Although the method
is relatively untested, and the resulting methane recovery would add cost
to the CCS process, sales of the methane could provide some cost offsets.13 Coal seam sequestration has an estimated storage capacity of 10 to 200
billion metric tons worldwide,14 including an estimated 157 to 178 billion
metric tons of capacity in the United States and Canada.15
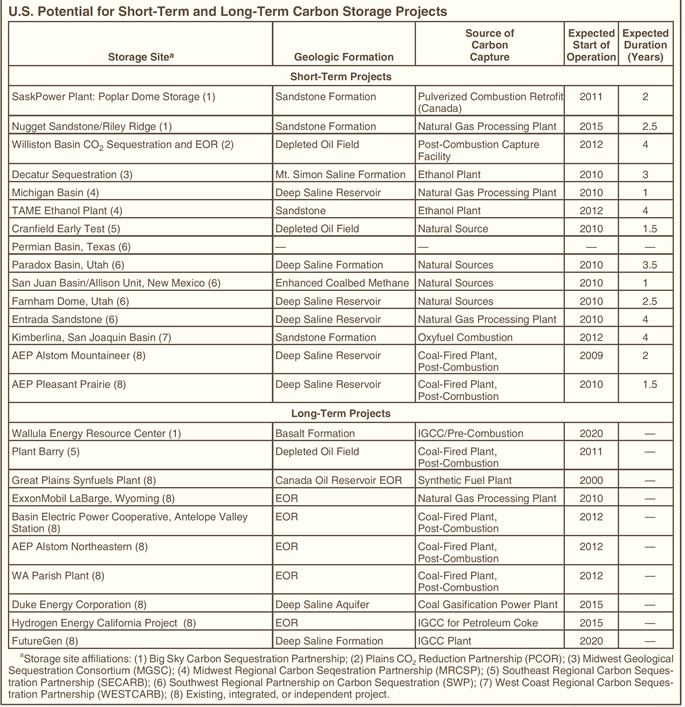
The table below lists CCS projects that currently are either operating
or actively being prepared for deployment. At present, there are few commercial-scale
projects in operation that integrate carbon capture from a coal-fired power
plant with transportation to a permanent storage site; however, a number
of projects and locations have been proposed. Given the possibility of
delays and project cancellations, it is unlikely that all the projects
listed will become operational on the dates planned. On the other hand,
other projects that are not included in the table may come to fruition.
|
|

|
| Residential Sector |
|
|
|
Residential sector carbon dioxide emissions originate primarily from:
-Direct fuel consumption (principally, natural gas) for heating and cooking
-Electricity for cooling (and heating), appliances, lighting, and increasingly
for televisions, computers, and
other household electronic devices (Table
7 below).
|
|
Energy consumed for heating in homes and businesses has a large influence
on the annual fluctuations in energy-related carbon dioxide emissions.
-The 5.6-percent increase in heating degree-days in 2008 was one of the
few upward pressures on emissions
in 2008 (Figure 9 on right).
-Although annual changes in cooling degree-days have a smaller impact on
energy demand, the 8.7-percent
decrease in 2008 offset some of the upward
pressure from the increase in heating degree-days. |
|
In the longer run, residential emissions are affected by population growth,
income, and other factors. From 1990 to 2008:.
-Residential sector carbon dioxide emissions grew by an average of 1.3 percent
per year.
-U.S. population grew by an average of 1.1 percent per year.
-Per-capita income (measured in constant dollars) grew by an average of
1.7 percent per year.
-Energy efficiency improvements for homes and appliances have offset much
of the growth in the number
and size of housing units. As a result, direct
fuel emissions from petroleum, coal, and natural gas consumed in
the residential
sector in 2008 were only 1.5 percent higher than in 1990. |
|
|

figure data
 |
| Commercial Sector |
|
|
|
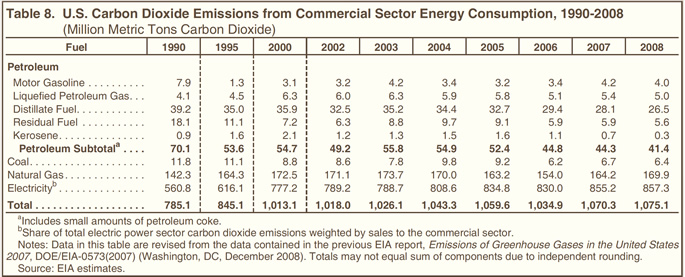
Commercial sector emissions (Table 8 below) are largely the result of energy
use for lighting, heating, and cooling in commercial structures, such as
office buildings, shopping malls, schools, hospitals, and restaurants.
|
|
The commercial sector was the only sector that showed positive growth in
emissions in 2008. |
|
Lighting accounts for a larger component of energy demand in the commercial
sector (approximately 18 percent of total demand in 2007) than in the residential
sector (approximately 11 percent of the total). |
|
Commercial sector emissions are affected less by weather than are residential
sector emissions: heating and cooling accounted for approximately 38 percent
of energy demand in the residential sector in 2007 but only about 21 percent
in the commercial sector.16 |
|
In the longer run, trends in emissions from the commercial sector parallel
economic trends. Commercial sector emissions grew at an average annual
rate of 1.8 percent from 1990 to 2008—slightly more than the growth in
real income per capita (Figure 10 on right). |
|
Emissions from direct fuel consumption in the commercial sector declined
from 1990 to 2008, while the sector’s electricity-related emissions increased
by an average of 2.4 percent per year. |
Data for all years 1990-2008
|
|

figure data
 |
| Industrial Sector |
|
|
|
Unlike commercial sector emissions, trends in U.S. industrial sector emissions
(Table 9 below) have not followed aggregate economic growth trends but have been
tied to trends in energy-intensive industries. In 2008, industrial carbon
dioxide emissions fell by 4.0 percent from their 2007 level and were 5.9
percent (100.4 MMT) below their 1990 level. Decreases in industrial sector
carbon dioxide emissions have resulted largely from a structural shift
away from energy-intensive manufacturing in the U.S. economy. |
|
Coke plants consumed 22.1 million short tons of coal in 2008, down from
38.9 million short tons in 1990. Other industrial coal consumption declined
from 76.3 million short tons in 1990 to 54.5 million short tons in 2008,
as reflected by the drop in emissions from coal shown in Figure 11 on right. |
|
The share of manufacturing activity represented by less energy-intensive
industries, such as computer chip and electronic component manufacturing,
has increased, while the share represented by the more energy-intensive
industries has fallen. |
|
By fuel, only total petroleum and net imports of coke in 2008 were above
1990 levels for the industrial sector. As mentioned above, coal use has
fallen since 1990, and natural gas use, which rose in the 1990s, has fallen
since 2000. |
|
|
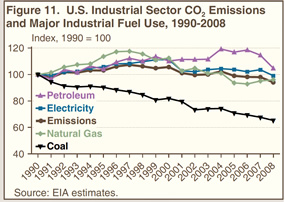
figure data
 |
| Transportation Sector |
|
|
|
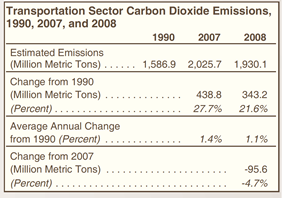
Transportation sector carbon dioxide emissions in 2008 were 95.6 MMT lower
than in 2007 but still 343.2 MMT higher than in 1990 (Table 10 below). |
|
The transportation sector has led all U.S. end-use sectors in emissions
of carbon dioxide since 1999; however, with higher fuel prices and slower
economic growth in 2008, emissions from the transportation sector fell
by 4.7 percent from their 2007 level. |
|
Petroleum combustion is the largest source of carbon dioxide emissions
in the transportation sector. |
|
Increases in ethanol fuel consumption in recent years have mitigated the
growth in transportation sector emissions. Reported emissions from energy
inputs to ethanol production plants are counted in the industrial sector. |
|
Transportation sector emissions from gasoline and diesel fuel combustion
since 1990 generally have paralleled total vehicle miles traveled (Figure
12 on right). |
|
|

figure data
|
| Electric Power Sector |
|
|
|
The electric power sector transforms primary energy fuels into electricity.
The sector consists of companies whose primary business is the generation
of electricity. |
|
Carbon dioxide emissions from electric power generation declined by 2.1
percent in 2008 (Figure 13 on right and Table 11 below). The drop resulted from a decrease
of 38.7 billion kilowatthours (1.0 percent) in the sector’s total electricity
generation and a 1.1-percent reduction in the carbon intensity of the electricity
supply. |
|
The lower overall carbon intensity of power generation in 2008 was the
result of a 50-percent increase (17.6 billion kilowatthours) in generation
from wind resources. |
|
Other non-carbon sources combined accounted for an additional 1 billion
kilowatthours of increased generation, despite a slight decline in generation
from nuclear power. |
|
Electricity generation from all fossil fuels fell by 57.4 billion kilowatthours
from 2007 to 2008. |
|
|

figure data

|
| Nonfuel Uses of Energy Inputs |
|
|
|
|
|

 |
| Adjustments to Energy Consumption |
|
|
|
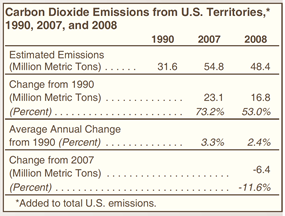
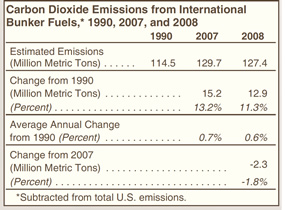
EIA’s greenhouse gas emissions inventory includes two “adjustments to energy
consumption” (Table 14 below). First, the energy consumption and carbon dioxide
emissions data in this report correspond to EIA’s coverage of energy consumption,
which includes the 50 States and the District of Columbia, but under the
UNFCCC the United States is also responsible for emissions emanating from
its Territories; therefore, their emissions are added to the U.S. total.
Second, because the UNFCCC definition of energy consumption excludes international
bunker fuels, emissions from international bunker fuels are subtracted
from the U.S. total. Similarly, because the UNFCCC excludes emissions from
military bunker fuels from national totals, they are subtracted from the
U.S. total. |
|
The net adjustment in emissions has been negative in every year from 1990
to 2008, because emissions from international and military bunker fuels
have always exceeded emissions from U.S. Territories. The net negative
adjustment for 2008 was 79.0 MMT. |
|
|
 |
| Other Sources |
|
|
|
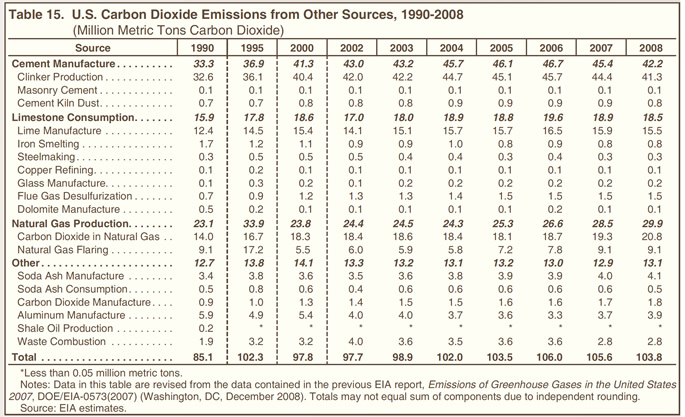
“Other emissions sources” in total accounted for 1.8 percent (103.8 MMT)
of all U.S. carbon dioxide emissions in 2008 (Figure 14 on right). |
|
The largest source of U.S. carbon dioxide emissions other than fossil fuel
consumption is cement manufacture (Table 15 below), where most emissions result
from the production of clinker (consisting of calcium carbonate sintered
with silica in a cement kiln to produce calcium silicate). |
|
Limestone consumption, especially for lime manufacture, is the source of
15 to 20 MMT of carbon dioxide emissions per year. |
|
In addition, “other sources” include: soda ash manufacture and consumption;
carbon dioxide manufacture; aluminum manufacture; flaring of natural gas
at the wellhead; carbon dioxide scrubbed from natural gas; and waste combustion
in the commercial and industrial sectors. |
|
|

figure data

|
Notes and Sources |
|
|
|
|