|
Download Data (XLS File) |
|
||||||||
|
||||||||
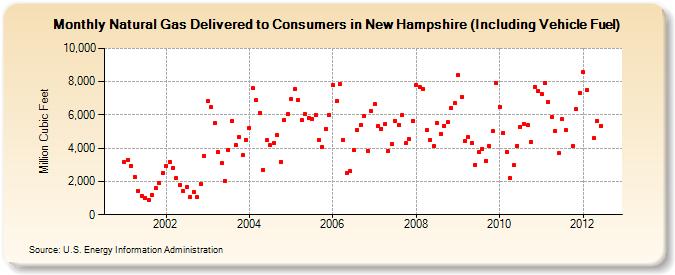
| Natural Gas Delivered to Consumers in New Hampshire (Including Vehicle Fuel) (Million Cubic Feet) | ||||||||
| Year | Jan | Feb | Mar | Apr | May | Jun | Jul | Aug | Sep | Oct | Nov | Dec |
|---|---|---|---|---|---|---|---|---|---|---|---|---|
| 2001 | 3,171 | 3,309 | 2,951 | 2,280 | 1,441 | 1,134 | 1,003 | 888 | 1,182 | 1,589 | 1,904 | 2,520 |
| 2002 | 2,917 | 3,188 | 2,833 | 2,179 | 1,815 | 1,423 | 1,657 | 1,055 | 1,381 | 1,038 | 1,847 | 3,507 |
| 2003 | 6,844 | 6,457 | 5,490 | 3,772 | 3,085 | 2,034 | 3,900 | 5,640 | 4,166 | 4,643 | 3,574 | 4,515 |
| 2004 | 5,204 | 7,595 | 6,870 | 6,131 | 2,712 | 4,473 | 4,167 | 4,306 | 4,766 | 3,194 | 5,704 | 6,026 |
| 2005 | 6,958 | 7,545 | 6,875 | 5,691 | 6,049 | 5,824 | 5,780 | 6,010 | 4,491 | 4,069 | 5,173 | 5,988 |
| 2006 | 7,782 | 6,823 | 7,852 | 4,511 | 2,505 | 2,608 | 3,895 | 5,107 | 5,407 | 5,917 | 3,850 | 6,263 |
| 2007 | 6,645 | 5,329 | 5,157 | 5,429 | 3,826 | 4,223 | 5,642 | 5,420 | 5,969 | 4,295 | 4,527 | 5,641 |
| 2008 | 7,786 | 7,653 | 7,558 | 5,076 | 4,511 | 4,124 | 5,536 | 4,876 | 5,352 | 5,548 | 6,443 | 6,692 |
| 2009 | 8,383 | 7,107 | 4,408 | 4,649 | 4,326 | 3,012 | 3,768 | 3,960 | 3,250 | 4,129 | 5,011 | 7,902 |
| 2010 | 6,463 | 4,922 | 3,785 | 2,178 | 2,970 | 4,156 | 5,300 | 5,446 | 5,378 | 4,385 | 7,692 | 7,464 |
| 2011 | 7,266 | 7,941 | 6,767 | 5,893 | 5,059 | 3,702 | 5,727 | 5,079 | NA | 4,126 | 6,353 | 7,334 |
| 2012 | 8,560 | 7,482 | NA | 4,587 | 5,639 | 5,344 | ||||||
| - = No Data Reported; -- = Not Applicable; NA = Not Available; W = Withheld to avoid disclosure of individual company data. |
| Release Date: 8/31/2012 |
| Next Release Date: 9/28/2012 |