|
Download Data (XLS File) |
|
||||||||
|
||||||||
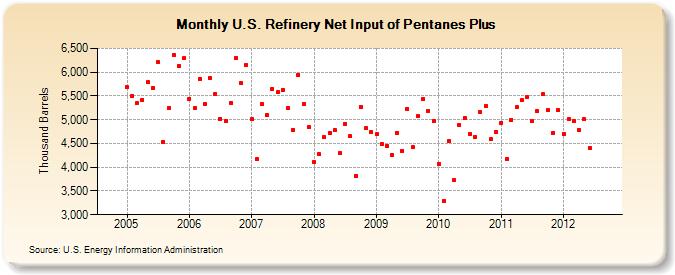
| U.S. Refinery Net Input of Pentanes Plus (Thousand Barrels) | ||||||||
| Year | Jan | Feb | Mar | Apr | May | Jun | Jul | Aug | Sep | Oct | Nov | Dec |
|---|---|---|---|---|---|---|---|---|---|---|---|---|
| 2005 | 5,678 | 5,502 | 5,344 | 5,421 | 5,783 | 5,672 | 6,208 | 4,536 | 5,244 | 6,368 | 6,130 | 6,288 |
| 2006 | 5,443 | 5,250 | 5,858 | 5,331 | 5,875 | 5,549 | 5,019 | 4,977 | 5,353 | 6,303 | 5,763 | 6,154 |
| 2007 | 5,008 | 4,166 | 5,336 | 5,094 | 5,649 | 5,572 | 5,629 | 5,244 | 4,785 | 5,941 | 5,328 | 4,839 |
| 2008 | 4,112 | 4,268 | 4,635 | 4,721 | 4,777 | 4,295 | 4,915 | 4,648 | 3,825 | 5,271 | 4,824 | 4,732 |
| 2009 | 4,690 | 4,491 | 4,450 | 4,253 | 4,730 | 4,347 | 5,227 | 4,423 | 5,082 | 5,430 | 5,188 | 4,981 |
| 2010 | 4,077 | 3,295 | 4,546 | 3,721 | 4,890 | 5,037 | 4,705 | 4,644 | 5,160 | 5,287 | 4,586 | 4,749 |
| 2011 | 4,937 | 4,172 | 5,001 | 5,258 | 5,412 | 5,481 | 4,972 | 5,173 | 5,531 | 5,197 | 4,725 | 5,200 |
| 2012 | 4,708 | 5,005 | 4,970 | 4,788 | 5,007 | 4,414 | ||||||
| - = No Data Reported; -- = Not Applicable; NA = Not Available; W = Withheld to avoid disclosure of individual company data. |
| Release Date: 8/30/2012 |
| Next Release Date: Last Week of September 2012 |
Referring Pages: