NextGen
Airport Performance — Albuquerque International Sunport
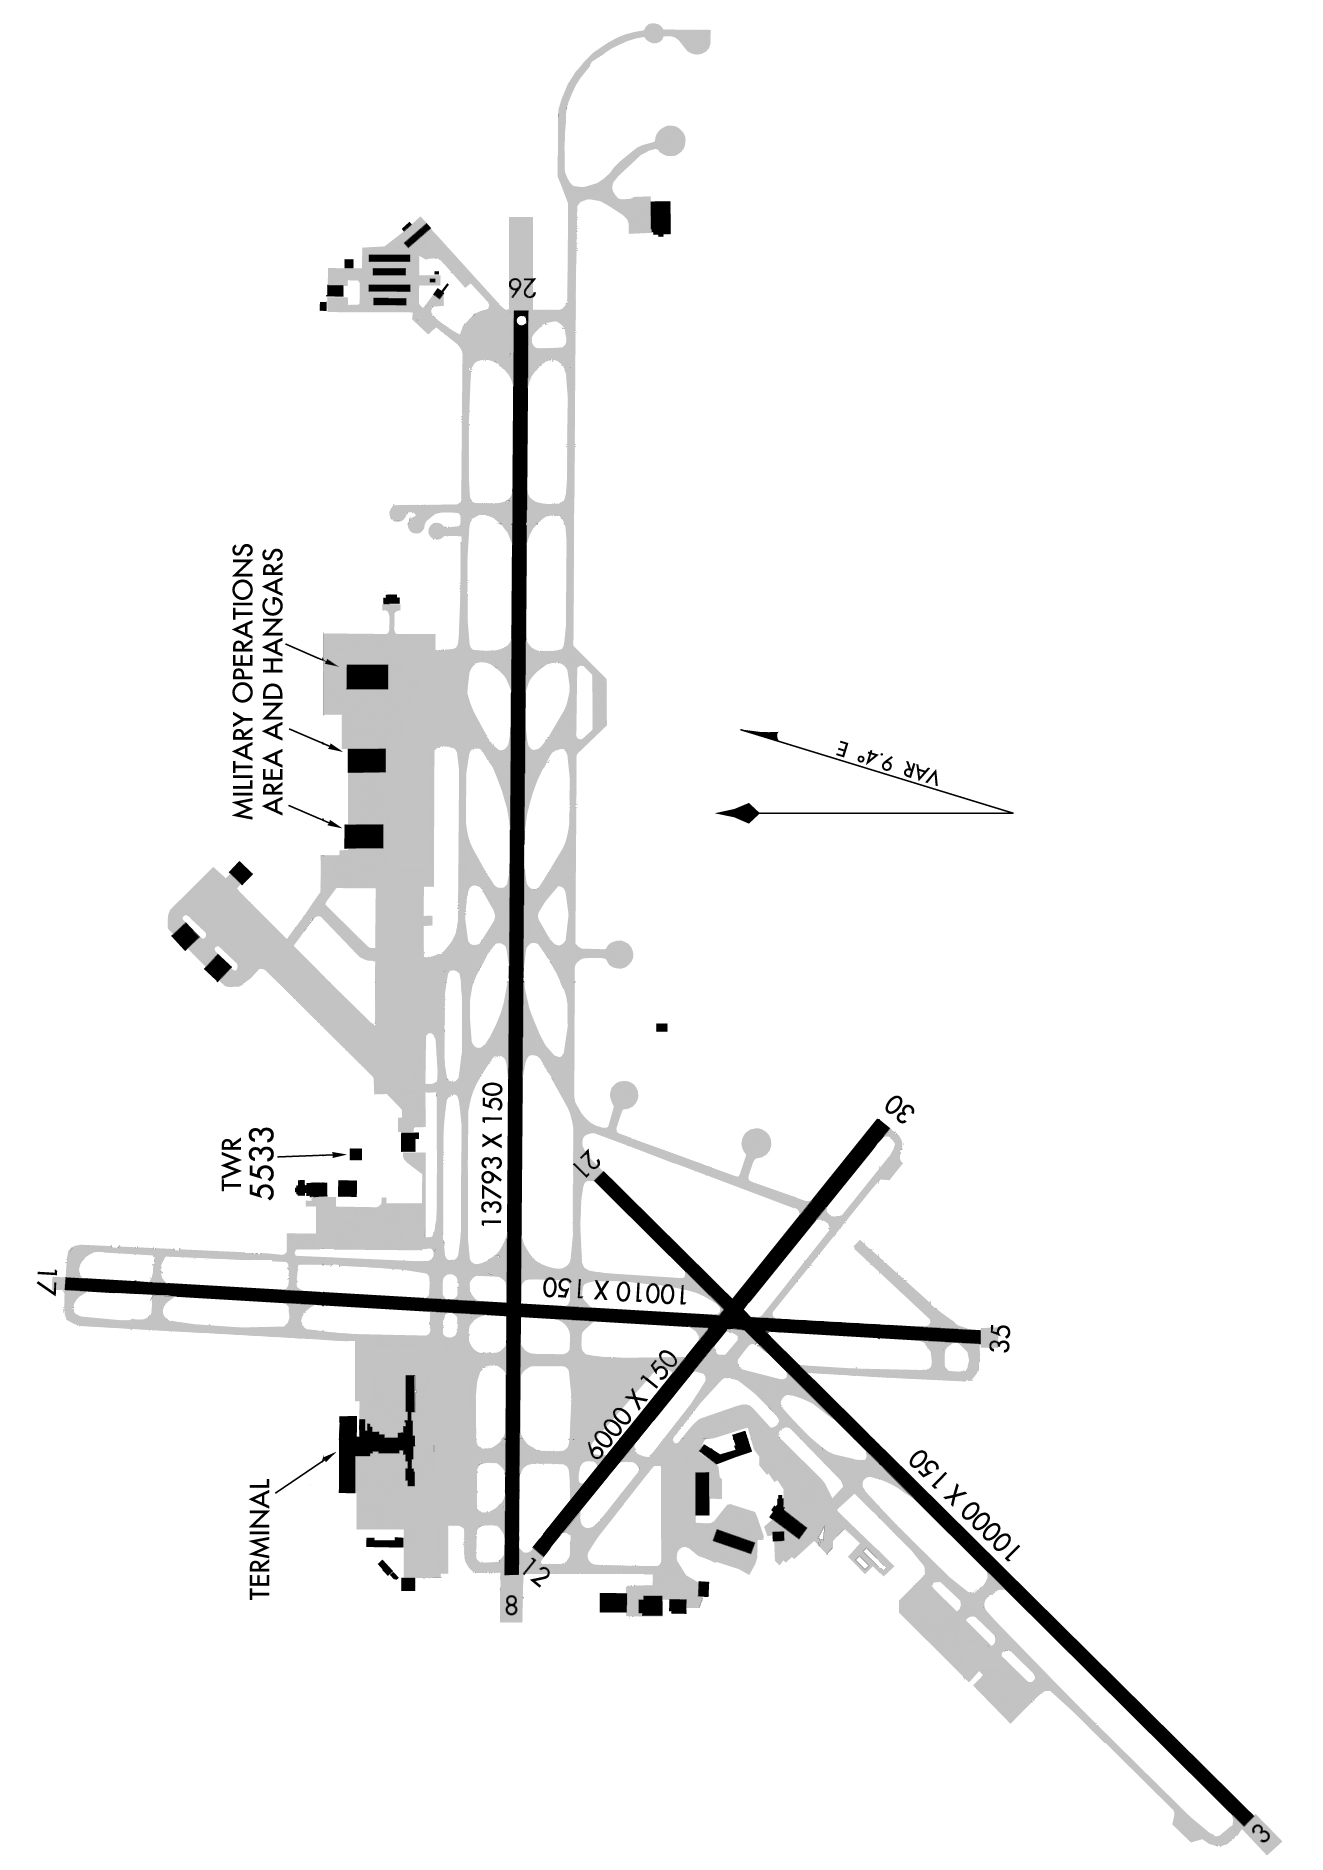
Albuquerque International Sunport is a public airport located southeast of the central business district of Albuquerque, New Mexico. It is the largest commercial airport in the state. The airport serves Albuquerque and Santa Fe.

| Performance Indicator |
2009 |
2010 |
2011 |
Average Daily Capacity
Operations per day
Daily Average of Cap AAR and ADR. ADR is the Airport Departure Rate, or the number of departures an airport can support, per unit of time. The Capacity Airport Arrival Rate (Cap AAR) is the number of arrivals an airport can support per unit of time. |
1,218.32 |
1,325.72 |
1,254.27 |
Peak Hourly Throughput (IMC)
Hourly Arrivals and Departures
Average daily peak hour arrivals and departures over the hours of 7:00 and 21:59 during Instrument Meteorological Conditions. |
18.27 |
18.25 |
17.09 |
Peak Hourly Throughput (VMC)
Hourly Arrivals and Departures
Average daily peak hour arrivals and departures over the hours of 7:00 and 21:59 during Visual Meteorological Conditions. |
18.62 |
18.05 |
16.82 |
High Low
The global ATM system should exploit the inherent capacity to meet airspace user demands at peak times and locations while minimizing restrictions on traffic flow. To respond to future growth, capacity must increase, along with corresponding increases in efficiency, flexibility and predictability, while ensuring that there are no adverse impacts on safety and giving due consideration to the environment. The ATM system must be resilient to service disruption and the resulting temporary loss of capacity.
| Performance Indicator |
2009 |
2010 |
2011 |
Arrival Taxi Time
Minutes per Flight
Taxi-In time is the average minutes elapsed from wheels-on to gate-in times. |
5.21 |
5.12 |
5.06 |
Average Taxi-In Delay
Minutes per Flight
The sum of minutes of Taxi-In Delay of 1 minute or more, divided by all arrivals. Taxi-In Delay equals actual Taxi-In time minus Unimpeded Taxi-In Time. |
0.66 |
0.63 |
0.51 |
Average Taxi-Out Delay
Minutes per Flight
The sum of minutes of Taxi-Out Delay of 1 minute or more, divided by all departures. Taxi-Out Delay equals Actual Taxi-Out Time minus Unimpeded Taxi-Out time. |
1.42 |
1.54 |
1.92 |
Block Delay (Compared with Flight Plan)
Minutes per Flight
The difference between Actual Gate-to-Gate time and flight plan Gate-to-Gate time. |
3.18 |
2.91 |
2.04 |
Block Time (Gate Out to Gate In)
Minutes per Flight
The difference between Actual Gate In and Actual Gate Out times. |
108.83 |
106.39 |
106.50 |
Departing Taxi Time
Minutes per Flight
The average of the time it takes for an aircraft to travel from the time it pushes back from the gate (its parking break is released) to the time its wheels lift off the ground. |
9.88 |
9.82 |
10.20 |
Flight Time (Wheels Off to Wheels On)
Minutes per Flight
The difference between Actual Wheels Off and Actual Wheels On times. |
90.63 |
88.38 |
88.76 |
Flight Time Delay (Compared with Flight Plan)
Minutes per Flight
The difference between Actual Off-to-On time and Flight Planned Off-to-On time. |
-0.64 |
-0.70 |
-1.32 |
Gate In Delay
Minutes per Flight
The difference between the Actual Gate In time and the Scheduled or Flight Plan Gate In time. |
8.00 |
7.99 |
7.34 |
Gate Out Delay
Minutes per Flight
The difference between the Actual Gate Out time and the Scheduled or Flight Plan Gate Out time. |
2.50 |
2.52 |
3.23 |
High Low
Efficiency addresses the operational and economic cost-effectiveness of gate-to-gate flight operations from a single-flight perspective. In all phases of flight, airspace users want to depart and arrive at the times they select and fly the trajectory they determine to be optimum.
| Performance Indicator |
2009 |
2010 |
2011 |
Standard Deviation of Block Delay
Minutes
Variability of the Block Delay (Efficiency KPA) metric |
4.32 |
4.74 |
4.39 |
Standard Deviation of Flight Time Delay
Minutes
Variability of the Flight Time Delay (Efficiency KPA) metric |
2.68 |
3.17 |
2.85 |
Standard Deviation of Gate In Delay
Minutes
Variability of the Gate In Delay (Efficiency KPA) metric |
9.61 |
11.02 |
10.06 |
Standard Deviation of Gate Out Delay
Minutes
Variability of the Gate Out Delay (Efficiency KPA) metric |
7.86 |
8.98 |
8.72 |
Standard Deviation of Taxi-In Delay
Minutes
Variability of the Taxi-In Delay (Efficiency KPA) metric |
1.13 |
1.14 |
1.19 |
Standard Deviation of Taxi-Out Delay
Minutes
Variability of the Taxi-Out Delay (Efficiency KPA) metric |
2.29 |
2.21 |
2.24 |
High Low
The Predictability Key Performance Area addresses the requirement of the ATM system to provide airspace users with consistent and dependable levels of performance.
Download Data as PDF