Occupational Employment and Wages, May 2011
11-9081 Lodging Managers
Plan, direct, or coordinate activities of an organization or department that provides lodging and other accommodations. Excludes "Food Service Managers" (11-9051) in lodging establishments.
National estimates for this occupation
Industry profile for this occupation
Geographic profile for this occupation
National estimates for this occupation: Top
Employment estimate and mean wage estimates for this occupation:
| Employment (1) |
Employment
RSE (3) |
Mean hourly
wage |
Mean annual
wage (2) |
Wage RSE (3) |
| 29,870 |
2.2 % |
$26.49 |
$55,100 |
0.8 % |
Percentile wage estimates for this occupation:
| Percentile |
10% |
25% |
50%
(Median) |
75% |
90% |
| Hourly Wage |
$14.20 |
$17.59 |
$22.81 |
$31.61 |
$42.95 |
| Annual Wage (2) |
$29,540 |
$36,590 |
$47,450 |
$65,750 |
$89,330 |
Industry profile for this occupation: Top
Industries with the highest published employment and wages for this occupation are provided.
For a list of all industries with employment in this occupation, see the Create Customized Tables function.
Industries with the highest levels of employment in this occupation:
Industries with the highest concentration of employment in this occupation:
Top paying industries for this occupation:
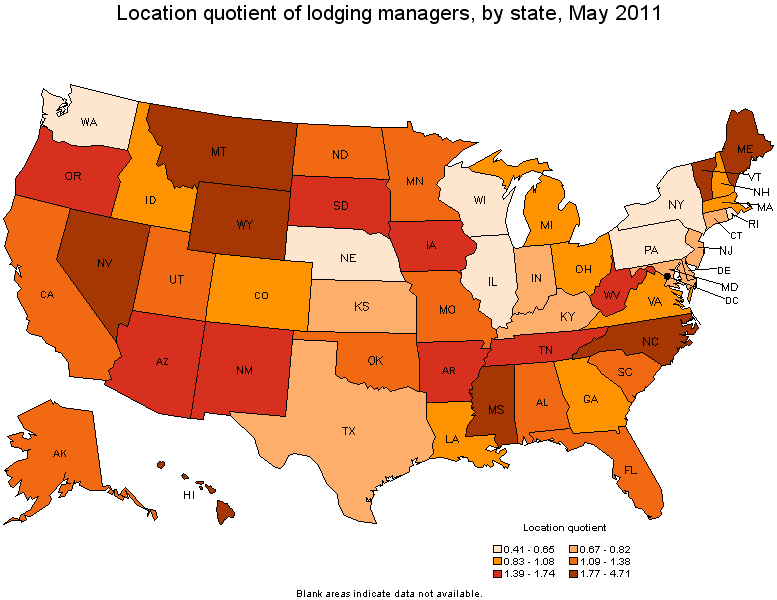
Geographic profile for this occupation: Top
States and areas with the highest published employment, location quotients, and wages for this occupation are provided.
For a list of all areas with employment in this occupation, see the Create Customized Tables function.
States with the highest employment level in this occupation:
| State |
Employment (1) |
Employment per thousand jobs |
Location quotient (9) |
Hourly mean wage |
Annual mean wage (2) |
| California |
3,930 |
0.28 |
1.20 |
$26.77 |
$55,680 |
| Florida |
1,910 |
0.27 |
1.15 |
$30.46 |
$63,350 |
| Texas |
1,820 |
0.18 |
0.76 |
$27.32 |
$56,820 |
| North Carolina |
1,640 |
0.43 |
1.85 |
$22.10 |
$45,980 |
| Ohio |
1,100 |
0.22 |
0.95 |
$24.39 |
$50,740 |
States with the highest concentration of jobs and location quotients in this occupation:
| State |
Employment (1) |
Employment per thousand jobs |
Location quotient (9) |
Hourly mean wage |
Annual mean wage (2) |
| Wyoming |
300 |
1.10 |
4.71 |
$19.61 |
$40,790 |
| Hawaii |
310 |
0.53 |
2.28 |
$33.20 |
$69,060 |
| Montana |
220 |
0.52 |
2.21 |
$19.08 |
$39,690 |
| Maine |
290 |
0.50 |
2.14 |
$20.64 |
$42,940 |
| Vermont |
140 |
0.49 |
2.10 |
$30.35 |
$63,130 |
Top paying States for this occupation:
| State |
Employment (1) |
Employment per thousand jobs |
Location quotient (9) |
Hourly mean wage |
Annual mean wage (2) |
| Delaware |
70 |
0.18 |
0.77 |
$40.82 |
$84,910 |
| Nevada |
460 |
0.41 |
1.77 |
$38.55 |
$80,180 |
| Massachusetts |
710 |
0.23 |
0.97 |
$36.22 |
$75,340 |
| Rhode Island |
70 |
0.15 |
0.65 |
$36.21 |
$75,320 |
| New York |
910 |
0.11 |
0.46 |
$36.20 |
$75,300 |
Metropolitan areas with the highest employment level in this occupation:
| Metropolitan area |
Employment (1) |
Employment per thousand jobs |
Location quotient (9) |
Hourly mean wage |
Annual mean wage (2) |
| Los Angeles-Long Beach-Glendale, CA Metropolitan Division |
720 |
0.19 |
0.81 |
$27.24 |
$56,650 |
| New York-White Plains-Wayne, NY-NJ Metropolitan Division |
610 |
0.12 |
0.52 |
$39.76 |
$82,700 |
| Washington-Arlington-Alexandria, DC-VA-MD-WV Metropolitan Division |
520 |
0.23 |
0.97 |
$32.89 |
$68,400 |
| San Diego-Carlsbad-San Marcos, CA |
450 |
0.37 |
1.57 |
$26.74 |
$55,620 |
| Phoenix-Mesa-Glendale, AZ |
450 |
0.27 |
1.14 |
$27.20 |
$56,570 |
| Atlanta-Sandy Springs-Marietta, GA |
400 |
0.18 |
0.77 |
$30.56 |
$63,560 |
| San Francisco-San Mateo-Redwood City, CA Metropolitan Division |
400 |
0.42 |
1.79 |
$33.58 |
$69,850 |
| Santa Ana-Anaheim-Irvine, CA Metropolitan Division |
390 |
0.28 |
1.19 |
$26.97 |
$56,100 |
| Chicago-Joliet-Naperville, IL Metropolitan Division |
380 |
0.11 |
0.45 |
$32.17 |
$66,910 |
| Boston-Cambridge-Quincy, MA NECTA Division |
360 |
0.21 |
0.92 |
$41.91 |
$87,170 |
Metropolitan areas with the highest concentration of jobs and location quotients in this occupation:
| Metropolitan area |
Employment (1) |
Employment per thousand jobs |
Location quotient (9) |
Hourly mean wage |
Annual mean wage (2) |
| Ocean City, NJ |
80 |
2.25 |
9.65 |
$26.60 |
$55,320 |
| Flagstaff, AZ |
90 |
1.59 |
6.85 |
$28.06 |
$58,360 |
| Napa, CA |
80 |
1.33 |
5.69 |
$25.89 |
$53,850 |
| San Luis Obispo-Paso Robles, CA |
110 |
1.14 |
4.90 |
$20.89 |
$43,440 |
| Myrtle Beach-North Myrtle Beach-Conway, SC |
120 |
1.12 |
4.83 |
$30.96 |
$64,390 |
| Asheville, NC |
180 |
1.10 |
4.71 |
$21.09 |
$43,860 |
| Brunswick, GA |
40 |
1.06 |
4.56 |
$27.21 |
$56,590 |
| Gulfport-Biloxi, MS |
100 |
1.00 |
4.30 |
$20.18 |
$41,980 |
| Salinas, CA |
140 |
0.93 |
4.00 |
$25.37 |
$52,760 |
| Sandusky, OH |
30 |
0.87 |
3.72 |
$17.67 |
$36,750 |
Top paying metropolitan areas for this occupation:
| Metropolitan area |
Employment (1) |
Employment per thousand jobs |
Location quotient (9) |
Hourly mean wage |
Annual mean wage (2) |
| Bethesda-Rockville-Frederick, MD Metropolitan Division |
80 |
0.15 |
0.64 |
$46.99 |
$97,730 |
| Las Vegas-Paradise, NV |
290 |
0.37 |
1.57 |
$44.43 |
$92,420 |
| Wilmington, DE-MD-NJ Metropolitan Division |
30 |
0.10 |
0.45 |
$42.75 |
$88,930 |
| Boston-Cambridge-Quincy, MA NECTA Division |
360 |
0.21 |
0.92 |
$41.91 |
$87,170 |
| Nassau-Suffolk, NY Metropolitan Division |
(8) |
(8) |
(8) |
$40.67 |
$84,590 |
| New York-White Plains-Wayne, NY-NJ Metropolitan Division |
610 |
0.12 |
0.52 |
$39.76 |
$82,700 |
| Charleston-North Charleston-Summerville, SC |
80 |
0.28 |
1.19 |
$36.93 |
$76,810 |
| Framingham, MA NECTA Division |
40 |
0.28 |
1.18 |
$36.21 |
$75,320 |
| Reno-Sparks, NV |
60 |
0.34 |
1.47 |
$36.18 |
$75,250 |
| Austin-Round Rock-San Marcos, TX |
(8) |
(8) |
(8) |
$35.79 |
$74,450 |
Nonmetropolitan areas with the highest employment in this occupation:
Nonmetropolitan areas with the highest concentration of jobs and location quotients in this occupation:
Top paying nonmetropolitan areas for this occupation:
About May 2011 National, State, Metropolitan, and Nonmetropolitan Area Occupational Employment and Wage Estimates
These estimates are calculated with data collected from employers in all industry sectors, all metropolitan and nonmetropolitan areas, and all states and the District of Columbia.
The top employment and wage figures are provided above. The complete list is available in the downloadable XLS files.
The percentile wage estimate is the value of a wage below which a certain percent of workers fall.
The median wage is the 50th percentile wage estimate--50 percent of workers earn less than the median and 50 percent of workers earn more than the median.
More about percentile wages.
(1) Estimates for detailed occupations do not sum to the totals because the totals include occupations not shown separately. Estimates do not include self-employed workers.
(2) Annual wages have been calculated by multiplying the hourly mean wage by a "year-round, full-time" hours figure of 2,080 hours;
for those occupations where there is not an hourly mean wage published, the annual wage has been directly calculated from the reported survey data.
(3) The relative standard error (RSE) is a measure of the reliability of a survey statistic. The smaller the relative standard error, the more precise the estimate.
(7) The value is less than .005 percent of industry employment.
(8) Estimate not released.
(9) The location quotient is the ratio of the area concentration of occupational employment to the national average concentration.
A location quotient greater than one indicates the occupation has a higher share of employment than average, and a location quotient less than one indicates the occupation is less prevalent in the area than average.
Other OES estimates and related information:
May 2011 National Occupational Employment and Wage Estimates
May 2011 State Occupational Employment and Wage Estimates
May 2011 Metropolitan and Nonmetropolitan Area Occupational Employment and Wage Estimates
May 2011 National Industry-Specific Occupational Employment and Wage Estimates
List of Occupations in SOC Code Number Order
List of Occupations in Alphabetical Order
Download May 2011 Occupational Employment and Wage Estimates in Zipped XLS files
Technical Notes
Last Modified Date: March 27, 2012