U.S. Energy Information Administration - EIA - Independent Statistics and Analysis
- Sources & Uses
- Topics
- Geography
Petroleum & Other Liquids
Crude oil, gasoline, heating oil, diesel, propane, and other liquids including biofuels and natural gas liquids.
Natural Gas
Exploration and reserves, storage, imports and exports, production, prices, sales.
Electricity
Sales, revenue and prices, power plants, fuel use, stocks, generation, trade, demand & emissions.
Consumption & Efficiency
Energy use in homes, commercial buildings, manufacturing, and transportation.
Coal
Reserves, production, prices, employ- ment and productivity, distribution, stocks, imports and exports.
Renewable &
Alternative Fuels
Includes hydropower, solar, wind, geothermal, biomass and ethanol.
Nuclear & Uranium
Uranium fuel, nuclear reactors, generation, spent fuel.
Total Energy
Comprehensive data summaries, comparisons, analysis, and projections integrated across all energy sources.
Highlights
This Week in Petroleum › Weekly Petroleum Status Report › Weekly Natural Gas Storage Report › Natural Gas Weekly Update › Electric Power Monthly › Quarterly Coal Report › Monthly Energy Review › Residential Energy Consumption Survey 2009 ›Analysis & Projections
Monthly and yearly energy forecasts, analysis of energy topics, financial analysis, Congressional reports.
Markets & Finance
Financial market analysis and financial data for major energy companies.
Environment
Greenhouse gas data, voluntary report- ing, electric power plant emissions.
Highlights
Short-Term Energy Outlook › Annual Energy Outlook › Emissions of Greenhouse Gases in the U. S. › International Energy Outlook ›- Tools
- Learn About Energy
- News
Today in Energy
Short, timely articles with graphics on energy, facts, issues, and trends.
Energy Explained
What is Energy? ›
Units & Calculators ›
Use of Energy ›
Energy & Environment ›
Petroleum ›
Natural Gas ›
Coal ›
Nuclear ›
Electricity ›
Hydropower ›
Biofuels: Ethanol & Biodiesel ›
Wind ›
Geothermal ›
Solar ›
Energy in Brief
What's changing in East Coast fuels markets? ›
What is shale gas and why is it important? ›
How dependent are we on foreign oil? ›
What is the role of coal in the United States? ›
-
What's New
Annual Energy Review ›
September 27
Monthly Energy Review ›
September 26
Solar Photovoltaic Cell/Module Shipments Report 2011 ›
September 26
More ›
Coming Up
Solar Photovoltaic Cell/Module Shipments Report ›
Annual Energy Review ›
Trends in Renewable Energy Consumption and Electricity ›
More ›
Posted September 27, 2012Today in Energy
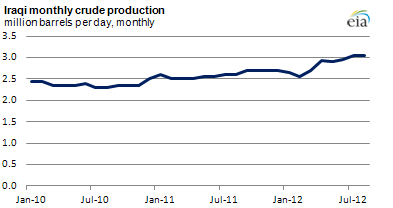
Iraqi crude oil production approaching highest level in decades ›
Estimated Iraqi oil production surpassed 3 million barrels per day (bbl/d) in July 2012, the highest level since the end of the Gulf War in 1990. Increased investment in Iraq's petroleum industry and export infrastructure underpin these production gains. However, many factors still constrain the Iraqi oil industry from reaching its full production potential. More›
Source: U.S. Energy Information Administration, Short-Term Energy Outlook.
Features
Who are the major players supplying the world oil market? ›
The world oil market is complicated. Oil companies and governments each play a role.
What is shale gas and why is it important? ›
Shale gas refers to natural gas that is trapped within shale formations.
Try out the new interactive Electricity Data Browser ›
Test-drive the Beta data browser to drill down into electricity data including generation, fuel consumption, sales, and prices.
Our Experts Speak
Administrator Adam Sieminski discusses "Global Oil Geopolitics" at the "Rio Oil & Gas Expo & Conference 2012" in Rio de Janeiro ›
September 17, 2012
Deputy Administrator Howard Gruenspecht reports on recent changes and key drivers in natural gas markets ›
September 11, 2012
More ›
Data Highlights
Crude oil futures price
9/26/2012: $89.98/bbl
down$2.00 from week earlier
up$5.53 from year earlierNatural gas futures price
9/26/2012: $3.023/mmBtu
up$0.261 from week earlier
down$0.804 from year earlierWeekly coal production
9/22/2012: 19.349 million tons
down0.854 million tons from week earlier
down2.309 million tons from year earlierNatural gas inventories
9/21/2012: 3,576 Bcf
up80 Bcf from week earlier
up296 Bcf from year earlierCrude oil inventories
9/21/2012: 365.2 mmbbl
down2.4 mmbbl from week earlier
up24.2 mmbbl from year earlierOutlooks
Learn About Energy
EIA - 1000 Independence Avenue, SW, Washington, DC 20585
About EIA
Press Room
Careers
Feedback
Contact Us
Sources & Uses
Petroleum
Coal
Natural Gas
Renewable
Nuclear
Electricity
Consumption
Total EnergyTopics
Analysis & Projections
Environment
Markets & Finance
Today in EnergyGeography
States
Countries
Maps
Tools
A-Z Index
All Reports
& Publications
EIA Survey FormsPolicies
Privacy/Security
Copyright & Reuse
AccessibilityRelated Sites
U.S. Department of Energy
USA.gov
FedStatsStay Connected
Twitter
Email Updates
RSS Feeds