|
Download Data (XLS File) |
|
||||||||
|
||||||||
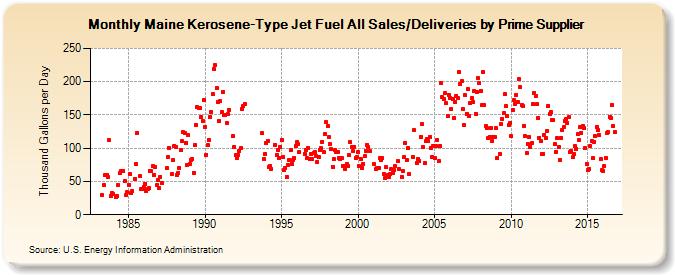
| Maine Kerosene-Type Jet Fuel All Sales/Deliveries by Prime Supplier (Thousand Gallons per Day) | ||||||||
| Year | Jan | Feb | Mar | Apr | May | Jun | Jul | Aug | Sep | Oct | Nov | Dec |
|---|---|---|---|---|---|---|---|---|---|---|---|---|
| 1983 | W | W | W | 30.0 | W | 44.0 | 59.9 | 59.4 | 56.9 | 111.6 | 28.6 | 33.0 |
| 1984 | 30.5 | W | 27.0 | 28.5 | 44.8 | 62.2 | 65.3 | 65.3 | 65.5 | 50.0 | 29.9 | 33.4 |
| 1985 | 45.1 | 61.1 | 32.4 | 34.9 | W | 54.2 | 76.0 | 122.6 | W | 57.5 | 38.6 | 38.7 |
| 1986 | 41.9 | 46.9 | 36.2 | 39.0 | 39.9 | 66.4 | 65.0 | 73.2 | 60.4 | 71.6 | 44.2 | 52.3 |
| 1987 | 39.7 | 57.1 | 47.5 | W | W | W | 69.6 | 86.9 | 100.8 | W | 61.4 | 81.9 |
| 1988 | 103.8 | 102.4 | 59.4 | 62.7 | 70.9 | 97.0 | 110.4 | 123.7 | 122.2 | 108.3 | 74.9 | 119.3 |
| 1989 | 75.6 | 82.5 | 84.3 | 63.1 | 104.3 | 135.2 | 162.1 | 159.8 | 159.7 | 147.2 | 140.7 | 172.5 |
| 1990 | 131.9 | 90.4 | 104.7 | 112.2 | 147.6 | 154.6 | 181.7 | 218.8 | 225.0 | 190.7 | 169.7 | 141.6 |
| 1991 | 170.5 | 154.4 | 185.1 | 150.0 | 150.5 | 138.2 | 151.6 | 157.1 | W | W | 117.9 | 101.3 |
| 1992 | 89.1 | 84.7 | 90.4 | 96.3 | 100.0 | 159.3 | 162.8 | 166.8 | W | W | W | W |
| 1993 | W | W | W | W | W | W | W | W | W | 122.3 | 84.3 | 91.6 |
| 1994 | 107.6 | 111.0 | 71.7 | 73.8 | 69.1 | W | W | 105.5 | 89.5 | 96.6 | 85.9 | 101.9 |
| 1995 | 112.9 | 86.6 | 66.6 | 70.8 | 57.3 | 74.7 | 82.2 | 96.6 | 76.5 | 82.5 | 84.9 | 103.5 |
| 1996 | 108.6 | 105.9 | 94.3 | W | W | W | 92.0 | 98.0 | 84.5 | 100.0 | 83.1 | 91.5 |
| 1997 | 83.2 | 92.9 | 94.3 | 88.5 | 79.6 | 86.1 | 96.9 | 99.7 | 109.6 | 95.0 | 121.4 | 139.3 |
| 1998 | 132.7 | 116.5 | 106.6 | 98.5 | 72.3 | 83.0 | 96.9 | 94.7 | 94.7 | 84.8 | 83.3 | 84.9 |
| 1999 | 73.5 | 73.8 | 68.1 | 75.6 | 72.7 | 89.9 | 108.7 | 102.5 | 95.6 | 102.5 | 85.2 | 86.5 |
| 2000 | 94.8 | 72.7 | 84.1 | 70.5 | 76.9 | 87.8 | 95.5 | 105.5 | 101.7 | 95.5 | W | W |
| 2001 | 76.0 | W | 68.4 | 70.4 | 70.7 | 84.8 | 82.2 | 85.3 | 61.3 | 54.5 | 71.1 | 60.3 |
| 2002 | 57.3 | 60.8 | 68.3 | 63.3 | 67.4 | 73.2 | W | 80.6 | 68.5 | W | 57.1 | 65.8 |
| 2003 | 86.7 | 108.4 | 82.5 | 100.2 | 61.1 | W | W | 86.8 | 126.9 | W | 78.2 | 83.3 |
| 2004 | 81.1 | 117.2 | 135.8 | 101.1 | 77.3 | 110.1 | 113.5 | 110.5 | 117.4 | 100.5 | 87.4 | 102.8 |
| 2005 | 85.8 | 103.4 | 112.4 | 80.2 | 102.8 | 198.6 | 176.7 | 173.9 | 182.8 | 167.2 | 147.7 | 180.5 |
| 2006 | 176.1 | 158.2 | 173.2 | 146.1 | 169.9 | 178.9 | 175.4 | 214.5 | 196.2 | 200.8 | 158.4 | 134.8 |
| 2007 | 179.5 | 151.4 | 188.4 | 148.8 | 167.9 | 174.8 | 169.1 | 185.6 | 151.9 | 184.6 | 205.1 | 197.3 |
| 2008 | 186.6 | 164.7 | 214.0 | 164.8 | 133.7 | 130.0 | 114.6 | 116.9 | 130.8 | 110.5 | 117.2 | 117.0 |
| 2009 | 129.8 | 85.3 | W | 91.2 | 136.6 | 144.2 | 152.2 | 180.7 | 163.0 | 147.7 | 135.1 | 138.3 |
| 2010 | 118.1 | 157.1 | 171.8 | 166.8 | 179.7 | 170.1 | 203.9 | 191.6 | 165.2 | 163.7 | 133.9 | 118.0 |
| 2011 | 92.1 | 106.5 | 116.9 | 102.2 | 107.3 | 166.2 | 183.0 | 177.7 | 166.8 | 145.2 | 115.7 | 111.5 |
| 2012 | 91.9 | 91.4 | 120.5 | 115.7 | 126.3 | 164.1 | 151.1 | 154.4 | 143.1 | 142.0 | 105.6 | 95.0 |
| 2013 | 115.1 | 102.5 | 81.6 | 115.8 | 127.2 | 131.1 | 141.6 | 144.0 | 137.8 | 146.7 | 93.8 | 95.8 |
| 2014 | 86.0 | 91.6 | 102.6 | 99.4 | 120.6 | 112.8 | 131.8 | 122.6 | 133.0 | 129.6 | 100.6 | 76.2 |
| 2015 | 67.5 | 69.0 | 103.1 | 110.3 | 85.2 | 109.9 | 117.7 | 131.5 | 127.0 | 120.1 | 83.5 | 66.5 |
| 2016 | 65.8 | 73.9 | 85.6 | 122.4 | 124.0 | 147.4 | 145.5 | 165.1 | 132.8 | 124.0 | ||
| - = No Data Reported; -- = Not Applicable; NA = Not Available; W = Withheld to avoid disclosure of individual company data. |
| Release Date: 12/21/2016 |
| Next Release Date: 1/24/2017 |