|
Download Data (XLS File) |
|
||||||||
|
||||||||
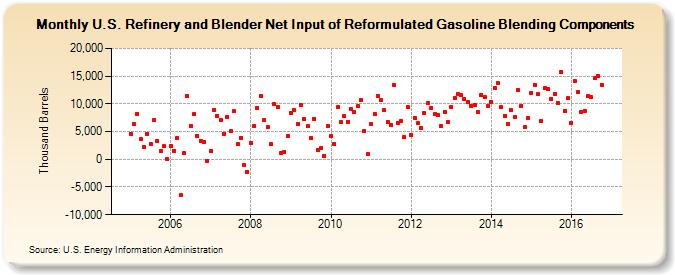
| U.S. Refinery and Blender Net Input of Reformulated Gasoline Blending Components (Thousand Barrels) | ||||||||
| Year | Jan | Feb | Mar | Apr | May | Jun | Jul | Aug | Sep | Oct | Nov | Dec |
|---|---|---|---|---|---|---|---|---|---|---|---|---|
| 2005 | 4,647 | 6,312 | 8,237 | 3,720 | 2,174 | 4,590 | 2,736 | 7,158 | 3,333 | 1,518 | 2,310 | -23 |
| 2006 | 2,363 | 1,565 | 3,845 | -6,509 | 1,125 | 11,333 | 6,069 | 8,101 | 4,111 | 3,355 | 3,199 | -251 |
| 2007 | 1,550 | 8,944 | 7,856 | 7,103 | 4,620 | 7,677 | 5,064 | 8,645 | 2,725 | 3,899 | -1,095 | -2,214 |
| 2008 | 3,005 | 6,016 | 9,313 | 11,341 | 7,084 | 5,733 | 2,703 | 9,882 | 9,463 | 1,174 | 1,382 | 4,212 |
| 2009 | 8,408 | 8,844 | 6,346 | 9,831 | 7,206 | 5,930 | 3,803 | 7,339 | 1,595 | 1,987 | 596 | 6,066 |
| 2010 | 4,176 | 2,783 | 9,409 | 6,633 | 7,741 | 6,725 | 9,009 | 8,503 | 9,539 | 10,611 | 5,087 | 990 |
| 2011 | 6,305 | 8,129 | 11,481 | 10,620 | 8,800 | 6,789 | 6,268 | 13,357 | 6,632 | 6,902 | 4,016 | 9,442 |
| 2012 | 4,436 | 7,491 | 6,492 | 5,646 | 8,307 | 10,102 | 9,315 | 8,080 | 7,985 | 5,963 | 8,553 | 6,790 |
| 2013 | 9,472 | 11,056 | 11,771 | 11,523 | 10,898 | 10,271 | 9,655 | 9,839 | 8,555 | 11,669 | 11,200 | 9,621 |
| 2014 | 10,413 | 12,879 | 13,672 | 9,425 | 7,828 | 6,307 | 8,908 | 7,699 | 12,450 | 9,697 | 5,760 | 7,477 |
| 2015 | 12,009 | 13,458 | 11,768 | 6,849 | 12,778 | 12,660 | 10,880 | 11,766 | 10,123 | 15,753 | 8,736 | 10,987 |
| 2016 | 6,605 | 14,202 | 12,114 | 8,546 | 8,733 | 11,455 | 11,153 | 14,632 | 14,981 | 13,480 | ||
| - = No Data Reported; -- = Not Applicable; NA = Not Available; W = Withheld to avoid disclosure of individual company data. |
| Release Date: 12/30/2016 |
| Next Release Date: 1/31/2017 |