|
Download Data (XLS File) |
|
||||||||
|
||||||||
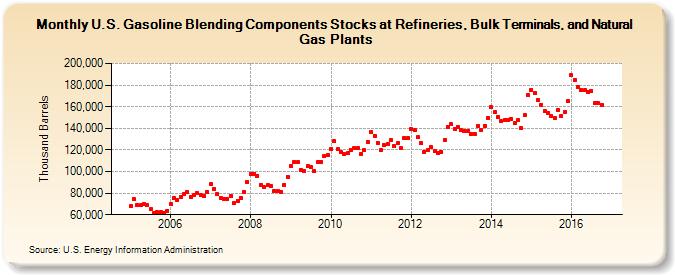
| U.S. Gasoline Blending Components Stocks at Refineries, Bulk Terminals, and Natural Gas Plants (Thousand Barrels) | ||||||||
| Year | Jan | Feb | Mar | Apr | May | Jun | Jul | Aug | Sep | Oct | Nov | Dec |
|---|---|---|---|---|---|---|---|---|---|---|---|---|
| 2005 | 67,624 | 74,150 | 68,841 | 68,734 | 69,774 | 68,972 | 65,000 | 61,510 | 62,304 | 62,173 | 61,451 | 63,827 |
| 2006 | 70,035 | 75,336 | 73,625 | 76,650 | 79,128 | 80,971 | 76,239 | 78,072 | 79,690 | 77,831 | 77,460 | 81,114 |
| 2007 | 88,253 | 84,263 | 79,097 | 75,817 | 74,592 | 74,522 | 77,711 | 70,680 | 72,843 | 75,802 | 80,913 | 90,707 |
| 2008 | 97,982 | 98,061 | 95,998 | 87,773 | 85,233 | 87,171 | 86,267 | 82,224 | 81,847 | 81,347 | 87,877 | 94,918 |
| 2009 | 105,069 | 108,984 | 108,446 | 101,767 | 100,320 | 104,681 | 104,391 | 100,193 | 108,462 | 108,848 | 114,051 | 114,995 |
| 2010 | 120,450 | 128,003 | 120,490 | 117,697 | 116,088 | 116,801 | 120,102 | 121,648 | 121,517 | 116,240 | 119,684 | 127,573 |
| 2011 | 136,349 | 133,122 | 126,474 | 119,822 | 124,383 | 125,471 | 128,916 | 123,415 | 126,123 | 121,523 | 131,138 | 130,602 |
| 2012 | 139,527 | 137,984 | 131,633 | 125,937 | 118,323 | 119,735 | 122,667 | 118,548 | 117,348 | 118,194 | 129,595 | 141,628 |
| 2013 | 143,565 | 139,631 | 141,335 | 138,285 | 137,514 | 137,943 | 134,989 | 135,026 | 142,403 | 138,512 | 142,430 | 149,944 |
| 2014 | 159,803 | 154,802 | 150,263 | 146,359 | 147,690 | 147,674 | 148,621 | 144,943 | 147,239 | 140,029 | 152,081 | 170,442 |
| 2015 | 175,818 | 172,976 | 166,438 | 161,984 | 155,843 | 154,196 | 151,415 | 149,594 | 156,574 | 151,720 | 155,507 | 165,123 |
| 2016 | 188,947 | 184,986 | 178,512 | 175,284 | 175,107 | 173,615 | 174,316 | 163,388 | 163,223 | 161,913 | ||
| - = No Data Reported; -- = Not Applicable; NA = Not Available; W = Withheld to avoid disclosure of individual company data. |
| Release Date: 12/30/2016 |
| Next Release Date: 1/31/2017 |