|
Download Data (XLS File) |
|
||||||||
|
||||||||
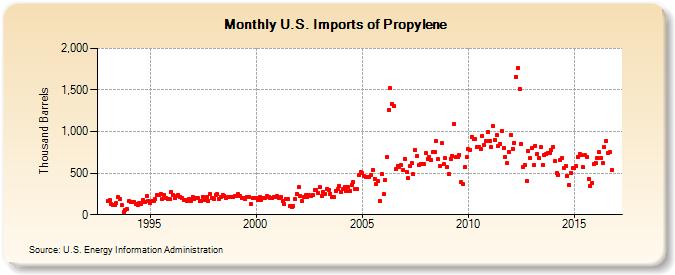
| U.S. Imports of Propylene (Thousand Barrels) | ||||||||
| Year | Jan | Feb | Mar | Apr | May | Jun | Jul | Aug | Sep | Oct | Nov | Dec |
|---|---|---|---|---|---|---|---|---|---|---|---|---|
| 1993 | 166 | 171 | 129 | 118 | 114 | 135 | 208 | 185 | 112 | 35 | 62 | 64 |
| 1994 | 161 | 157 | 150 | 155 | 131 | 112 | 145 | 129 | 181 | 155 | 231 | 170 |
| 1995 | 137 | 159 | 166 | 187 | 232 | 232 | 249 | 185 | 240 | 199 | 193 | 188 |
| 1996 | 274 | 243 | 202 | 223 | 242 | 210 | 200 | 174 | 177 | 170 | 191 | 165 |
| 1997 | 217 | 190 | 199 | 198 | 163 | 166 | 219 | 171 | 209 | 162 | 250 | 200 |
| 1998 | 184 | 235 | 247 | 189 | 216 | 243 | 231 | 195 | 207 | 209 | 218 | 209 |
| 1999 | 230 | 229 | 245 | 226 | 195 | 206 | 191 | 217 | 217 | 127 | 195 | 201 |
| 2000 | 205 | 180 | 214 | 180 | 202 | 201 | 228 | 219 | 206 | 203 | 216 | 218 |
| 2001 | 222 | 200 | 211 | 169 | 131 | 190 | 186 | 104 | 90 | 107 | 183 | 255 |
| 2002 | 329 | 227 | 160 | 214 | 234 | 211 | 233 | 228 | 241 | 302 | 303 | 262 |
| 2003 | 329 | 228 | 276 | 253 | 314 | 302 | 253 | 217 | 215 | 289 | 305 | 345 |
| 2004 | 274 | 305 | 339 | 287 | 331 | 280 | 360 | 396 | 314 | 309 | 476 | 514 |
| 2005 | 499 | 469 | 456 | 449 | 451 | 483 | 541 | 431 | 369 | 402 | 166 | 491 |
| 2006 | 248 | 419 | 688 | 1,263 | 1,520 | 1,330 | 1,302 | 545 | 589 | 578 | 597 | 535 |
| 2007 | 675 | 514 | 441 | 585 | 619 | 485 | 780 | 702 | 593 | 613 | 607 | 607 |
| 2008 | 738 | 674 | 690 | 657 | 753 | 759 | 889 | 666 | 589 | 859 | 604 | 677 |
| 2009 | 569 | 491 | 673 | 707 | 1,096 | 688 | 696 | 720 | 388 | 365 | 568 | 693 |
| 2010 | 786 | 783 | 939 | 913 | 914 | 817 | 815 | 785 | 950 | 841 | 885 | 995 |
| 2011 | 891 | 813 | 1,062 | 902 | 956 | 827 | 856 | 1,012 | 803 | 692 | 618 | 759 |
| 2012 | 957 | 796 | 866 | 1,661 | 1,768 | 1,513 | 854 | 579 | 595 | 400 | 762 | 677 |
| 2013 | 800 | 597 | 831 | 728 | 680 | 811 | 595 | 722 | 728 | 743 | 746 | 776 |
| 2014 | 816 | 641 | 503 | 478 | 662 | 680 | 564 | 587 | 464 | 357 | 503 | 564 |
| 2015 | 561 | 588 | 699 | 731 | 714 | 569 | 714 | 699 | 433 | 344 | 383 | 608 |
| 2016 | 625 | 682 | 749 | 686 | 623 | 812 | 885 | 740 | 749 | 535 | ||
| - = No Data Reported; -- = Not Applicable; NA = Not Available; W = Withheld to avoid disclosure of individual company data. |
| Release Date: 12/30/2016 |
| Next Release Date: 1/31/2017 |