|
Download Data (XLS File) |
|
||||||||
|
||||||||
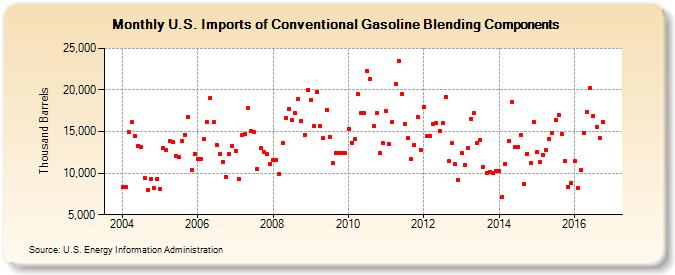
| U.S. Imports of Conventional Gasoline Blending Components (Thousand Barrels) | ||||||||
| Year | Jan | Feb | Mar | Apr | May | Jun | Jul | Aug | Sep | Oct | Nov | Dec |
|---|---|---|---|---|---|---|---|---|---|---|---|---|
| 2004 | 8,284 | 8,360 | 14,961 | 16,100 | 14,435 | 13,265 | 13,091 | 9,415 | 8,003 | 9,354 | 8,155 | 9,326 |
| 2005 | 8,112 | 13,026 | 12,822 | 13,838 | 13,690 | 12,027 | 11,924 | 13,858 | 14,614 | 16,707 | 10,356 | 12,354 |
| 2006 | 11,664 | 11,686 | 14,158 | 16,117 | 19,022 | 16,177 | 13,412 | 12,332 | 11,320 | 9,577 | 12,329 | 13,305 |
| 2007 | 12,699 | 9,343 | 14,550 | 14,692 | 17,859 | 15,109 | 14,965 | 10,512 | 12,984 | 12,574 | 12,242 | 11,101 |
| 2008 | 11,536 | 11,606 | 9,900 | 13,585 | 16,619 | 17,758 | 16,393 | 17,204 | 18,878 | 16,271 | 14,644 | 20,005 |
| 2009 | 18,829 | 15,717 | 19,803 | 15,623 | 14,178 | 17,642 | 14,399 | 11,209 | 12,378 | 12,382 | 12,374 | 12,385 |
| 2010 | 15,357 | 13,669 | 14,065 | 19,507 | 17,236 | 17,192 | 22,274 | 21,320 | 15,690 | 17,177 | 12,470 | 13,593 |
| 2011 | 17,444 | 13,466 | 16,206 | 20,736 | 23,517 | 19,526 | 15,862 | 14,186 | 11,710 | 13,369 | 16,754 | 12,821 |
| 2012 | 17,976 | 14,500 | 14,421 | 15,858 | 16,046 | 15,126 | 16,010 | 19,205 | 11,449 | 13,583 | 11,048 | 9,212 |
| 2013 | 12,393 | 10,935 | 13,025 | 16,457 | 17,182 | 13,592 | 14,019 | 10,786 | 10,048 | 10,165 | 9,977 | 10,301 |
| 2014 | 10,207 | 7,131 | 11,127 | 13,856 | 18,575 | 13,181 | 13,197 | 14,541 | 8,709 | 12,354 | 11,223 | 16,151 |
| 2015 | 12,515 | 11,286 | 12,195 | 12,779 | 14,140 | 14,825 | 16,407 | 16,937 | 14,753 | 11,440 | 8,324 | 8,762 |
| 2016 | 11,432 | 8,154 | 10,344 | 14,866 | 17,358 | 20,192 | 16,888 | 15,583 | 14,274 | 16,204 | ||
| - = No Data Reported; -- = Not Applicable; NA = Not Available; W = Withheld to avoid disclosure of individual company data. |
| Release Date: 12/30/2016 |
| Next Release Date: 1/31/2017 |