|
Download Data (XLS File) |
|
|||||
|
|||||
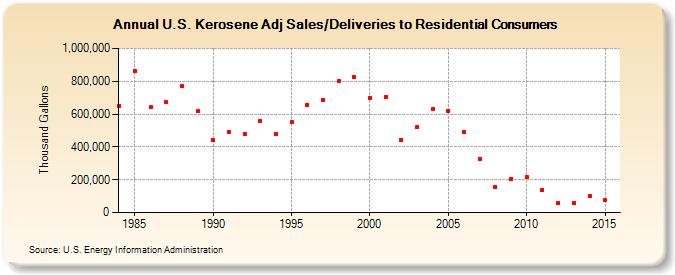
| U.S. Kerosene Adj Sales/Deliveries to Residential Consumers (Thousand Gallons) | |||||
| Decade | Year-0 | Year-1 | Year-2 | Year-3 | Year-4 | Year-5 | Year-6 | Year-7 | Year-8 | Year-9 |
|---|---|---|---|---|---|---|---|---|---|---|
| 1980's | 651,953 | 862,573 | 641,742 | 671,350 | 770,042 | 618,322 | ||||
| 1990's | 439,870 | 491,929 | 481,511 | 560,103 | 480,916 | 550,336 | 657,636 | 688,025 | 802,348 | 823,436 |
| 2000's | 700,532 | 704,305 | 443,919 | 520,799 | 627,842 | 620,767 | 491,508 | 325,320 | 157,505 | 205,136 |
| 2010's | 215,587 | 137,232 | 57,316 | 61,188 | 101,852 | 74,945 |
| - = No Data Reported; -- = Not Applicable; NA = Not Available; W = Withheld to avoid disclosure of individual company data. |
| Release Date: 12/5/2016 |
| Next Release Date: Last Week of November 2017 |