|
Download Data (XLS File) |
|
||||||||
|
||||||||
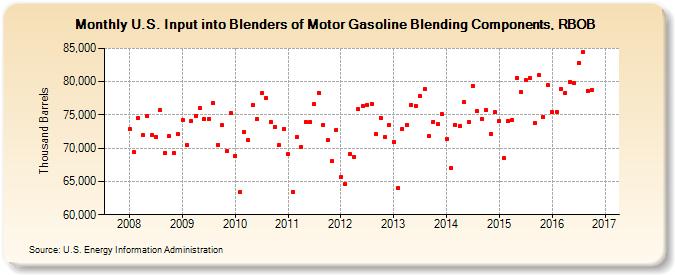
| U.S. Input into Blenders of Motor Gasoline Blending Components, RBOB (Thousand Barrels) | ||||||||
| Year | Jan | Feb | Mar | Apr | May | Jun | Jul | Aug | Sep | Oct | Nov | Dec |
|---|---|---|---|---|---|---|---|---|---|---|---|---|
| 2008 | 72,828 | 69,364 | 74,510 | 71,919 | 74,782 | 71,950 | 71,741 | 75,693 | 69,267 | 71,763 | 69,295 | 72,066 |
| 2009 | 74,197 | 70,434 | 74,112 | 74,888 | 76,011 | 74,370 | 74,351 | 76,767 | 70,547 | 73,421 | 69,528 | 75,235 |
| 2010 | 68,884 | 63,354 | 72,420 | 71,229 | 76,474 | 74,332 | 78,244 | 77,599 | 73,898 | 73,192 | 70,418 | 72,943 |
| 2011 | 69,096 | 63,473 | 71,683 | 70,237 | 73,970 | 73,919 | 76,623 | 78,360 | 73,512 | 71,165 | 68,055 | 72,789 |
| 2012 | 65,606 | 64,578 | 69,122 | 68,713 | 75,823 | 76,346 | 76,492 | 76,712 | 72,071 | 74,581 | 71,653 | 73,506 |
| 2013 | 70,941 | 64,006 | 72,950 | 73,547 | 76,537 | 76,365 | 77,866 | 78,893 | 71,820 | 74,009 | 73,598 | 75,132 |
| 2014 | 71,322 | 67,009 | 73,489 | 73,274 | 76,935 | 73,925 | 79,406 | 75,529 | 74,435 | 75,751 | 72,136 | 75,423 |
| 2015 | 74,071 | 68,466 | 74,043 | 74,202 | 80,607 | 78,389 | 80,241 | 80,547 | 73,769 | 80,937 | 74,666 | 79,423 |
| 2016 | 75,414 | 75,485 | 78,917 | 78,357 | 79,958 | 79,817 | 82,860 | 84,448 | 78,610 | 78,810 | ||
| - = No Data Reported; -- = Not Applicable; NA = Not Available; W = Withheld to avoid disclosure of individual company data. |
| Release Date: 12/30/2016 |
| Next Release Date: 1/31/2017 |