|
Download Data (XLS File) |
|
||||||||
|
||||||||
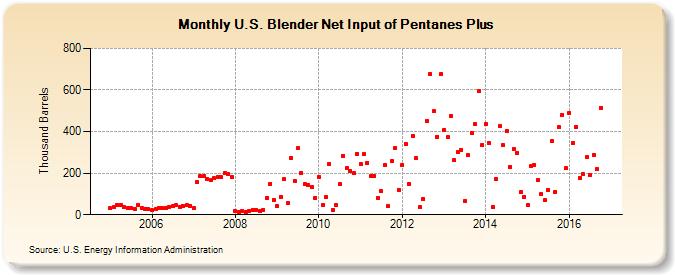
| U.S. Blender Net Input of Pentanes Plus (Thousand Barrels) | ||||||||
| Year | Jan | Feb | Mar | Apr | May | Jun | Jul | Aug | Sep | Oct | Nov | Dec |
|---|---|---|---|---|---|---|---|---|---|---|---|---|
| 2005 | 30 | 38 | 46 | 49 | 35 | 32 | 31 | 29 | 47 | 33 | 29 | 27 |
| 2006 | 21 | 26 | 33 | 32 | 33 | 36 | 40 | 45 | 39 | 44 | 45 | 43 |
| 2007 | 33 | 156 | 186 | 186 | 172 | 166 | 175 | 182 | 179 | 201 | 195 | 181 |
| 2008 | 16 | 15 | 18 | 13 | 20 | 25 | 23 | 19 | 24 | 80 | 149 | 72 |
| 2009 | 40 | 86 | 170 | 55 | 273 | 161 | 319 | 202 | 146 | 142 | 134 | 80 |
| 2010 | 183 | 47 | 85 | 243 | 24 | 49 | 146 | 284 | 225 | 210 | 199 | 294 |
| 2011 | 243 | 290 | 249 | 185 | 186 | 82 | 112 | 238 | 40 | 257 | 323 | 121 |
| 2012 | 238 | 339 | 150 | 378 | 272 | 35 | 76 | 450 | 678 | 497 | 376 | 675 |
| 2013 | 409 | 373 | 474 | 261 | 301 | 313 | 67 | 287 | 393 | 434 | 593 | 336 |
| 2014 | 435 | 343 | 36 | 170 | 425 | 333 | 404 | 230 | 317 | 299 | 107 | 85 |
| 2015 | 45 | 236 | 240 | 168 | 98 | 69 | 119 | 353 | 111 | 420 | 479 | 223 |
| 2016 | 489 | 347 | 423 | 177 | 194 | 276 | 191 | 288 | 218 | 515 | ||
| - = No Data Reported; -- = Not Applicable; NA = Not Available; W = Withheld to avoid disclosure of individual company data. |
| Release Date: 12/30/2016 |
| Next Release Date: 1/31/2017 |
Referring Pages: