November 04, 2010 (The Editor’s Desk is updated each business day.)
Metropolitan area employment, September 2010
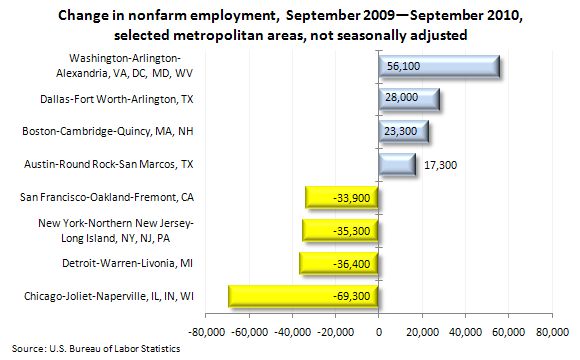
The largest over-the-year increase in employment from September 2009 to September 2010 occurred in Washington-Arlington-Alexandria, D.C.-Virginia-Maryland-West Virginia (+56,100), followed by Dallas-Fort Worth-Arlington, Texas (+28,000), Boston-Cambridge-Quincy, Massachusetts-New Hampshire (+23,300) and Austin-Round Rock-San Marcos, Texas (+17,300).
[Chart data]
The largest over-the-year employment decrease was recorded in Chicago-Joliet-Naperville, Illinois-Indiana-Wisconsin (‑69,300), followed by Detroit-Warren-Livonia, Michigan (‑36,400), New York-Northern New Jersey-Long Island, New York-New Jersey-Pennsylvania (‑35,300), and San Francisco-Oakland-Fremont, California (‑33,900).
In September 2010, 193 metropolitan areas reported over-the-year decreases in nonfarm employment, 168 reported increases, and 11 had no change.
The data are from the Current Employment Statistics (State and Metro Area) program. The most recent month’s data are preliminary and subject to revision. To learn more, see "Metropolitan Area Employment and Unemployment — September 2010" (HTML) (PDF), news release USDL-10-1517.
Related TED articles
Employment |
Metropolitan areas and counties
Of interest
Spotlight on Statistics: National Hispanic Heritage Month
In this Spotlight, we take a look at the Hispanic labor force—including labor force participation, employment and unemployment, educational attainment, geographic location, country of birth, earnings, consumer expenditures, time use, workplace injuries, and employment projections.
.
Read more »