Patent Performance for the year 2003
Patent Performance
The core process of the Patent Organization is the examination of an inventors application for a patent by comparing the claimed subject matter of the application to a large body of technological information to determine whether the claimed invention is new, useful, and non-obvious to someone knowledgeable in that subject matter. In the course of examining a patent application, a patent examiner makes a determination on the patentability of the claimed subject matter. Examiners are also responsible for preparing examiners answers on appealed applications and preparing interference proceedings to determine priority of ownership.
Other phases of the examination process include: pre-examination, where the application receives an initial administrative review; post-examination, where the published application or issued patent is disseminated to the public; and a quality review function, which reviews a random sample of both in-process and allowed applications. Additionally, the Patent Cooperation Treaty (PCT) office administers the processing of international patent applications. The Search and Information Resources Administration is responsible for managing all Patent automation activities, implementing and maintaining classification schemes for organizing and retrieving technical information contained in patents and other documents in the search files, and acquiring, maintaining, and providing access to scientific and technical literature in support of the examination process. The Board of Patent Appeals and Interferences (BPAI) conducts interference proceedings, as well as decides appeals regarding issues of patentability.
In FY 2003, the Patent Organization received 333,452 Utility, Plant, and Reissue patent applications. Additionally, preliminary data indicates that 243,007 pending applications were published within 18 months after filing and 173,072 patents were granted.
The Patent Organization made significant strides towards achieving the e-Gov and quality goals of the 21st Century Strategic Plan by implementation of the Image File Wrapper (IFW) and quality initiatives. The IFW is an electronic version of the paper patent application file wrapper, and is created by scanning all papers in the file wrapper using a modified version of the software initially developed by the EPO. The IFW provides instant and concurrent access to a patent application, eliminates examiner interruption for paper entry, and eliminates lost or damaged papers from paper patent applications. The IFW has already been deployed to the Office of Initial Patent Examination and portions of the Patent Examination Corps, with an expectation of full deployment by October 2004. As a result, over 225,000 electronic applications are now considered the official file, and all newly filed patent applications are now processed in an electronic environment.
The quality initiatives implemented by the Patent Organization include: a pre-employment assessment of communication skills for new hires through oral interviews and writing samples, supervisory training for effective work product reviews, redesigning the quality review process by expanding in process reviews, pilot training programs in art units for new examiners, and finalizing the process for certifying the formal knowledge, skills, and abilities (KSA) required of examination staff at various stages of their careers. The Patent Organization quality initiatives will ensure the highest quality patent examination possible by certifying that patent examiners, supervisory patent examiners, and quality assurance specialists have the requisite skills by providing the most pertinent and up-to-date training and enhanced review processes.
Specific performance results related to the Patent Organization goals and measures are as follows:
GOAL: AGILITY − Address the 21st Century Economy by Becoming a More Agile Organization
Under the 21st Century Strategic Plan , the USPTO will work with our IP partners to improve the efficiency of our processing systems by increasing the number of applications and communications received and processed electronically, create more coordinated and streamlined work processes, and best position the USPTO for the globalization that characterizes the 21st century economy. The following performance measure has been established to reflect the USPTO's success and progress in meeting the 21st Century Strategic Plan goals for agility.
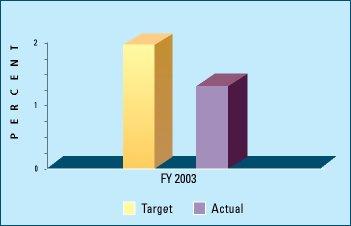
NEW MEASURE: Applications Filed Electronically
 D
DDATA VALIDATION AND VERIFICATION
- Data source: Patent Application Location and Monitoring (PALM) system.
- Frequency: Daily input, weekly reporting.
- Data storage: PALM and automated systems.
- Verification: Accuracy of supporting data is controlled through internal program edits in the PALM system and cross checks against other automated systems.
- Data Limitations: None.
| FY 2000 | FY 2001 | FY 2002 | FY 2003 | |
|---|---|---|---|---|
| Target | - | - | - | 2.0% |
| Actual | - | - | - | 1.3% not met |
Discussion: Target not met. This measure indicates USPTO's support of, and applicants' willingness to operate in, an e-Gov environment and identifies the percent of basic patent applications filed electronically. There is some reluctance on the part of the patent applicants to file electronically including: 1) customers are familiar with the paper based systems already in place; 2) they have not invested the time and resources necessary to upgrade their internal processes to enable them to file electronically; and 3) they would like to receive some incentive (in the form of fee reduction) for filing electronically.
GOAL: CAPABILITY − Enhance the Quality through Workforce and Process Improvements
Under the 21st Century Strategic Plan , Patents will enhance current quality assurance programs to include a more in-depth review of work in progress. This will include the implementation of in-process reviews, "second pair of eyes" reviews, and end-process reviews. In addition, the Patent Organization is creating new programs for certifying the KSAs of their employees.
With the 21st Century Strategic Plan , the USPTO developed a number of new measures to assess its achievement toward the capability goals. For those new measures, the USPTO will need to establish its baseline performance during FY 2004 before establishing its out-year targets and annual goals.
MEASURE: Improve the quality of patents by reducing the error rate
 D
DDATA VALIDATION AND VERIFICATION
- Data source: Office of Patent Quality Review Report.
- Frequency: Daily input, monthly reporting.
- Data storage: Automated systems, reports.
- Verification: Manual reports and analysis.
- Data Limitations: None.
| FY 2000 | FY 2001 | FY 2002 | FY 2003 | |
|---|---|---|---|---|
| Target | - | 5.5% | 5.0% | 4.0% |
| Actual | 6.6% | 5.4% | 4.2% | 4.4% not met |
Discussion: Target not met. An error is defined as at least one claim within the randomly selected allowed application under quality review that would be held invalid in a court of law, if the application were to issue as a patent without the required correction. Some examples of errors include the issuance of a claim having anticipatory prior art under 35 U.S.C. 102, or relevant prior art under 35 U.S.C. 103 that would render the allowed claim obvious. Other errors include lack of compliance of the claim to the other statutory requirements (e.g., 35 U.S.C. 101, 35 U.S.C. 112) and judicially created doctrines. The error rate is the ratio of allowed applications with errors to the total number of allowed applications reviewed.
The USPTO fell short of its FY 2003 target; however, under the 21st Century Strategic Plan , the Patents Organization is enhancing current quality assurance programs to include a more in-depth review of work in progress.
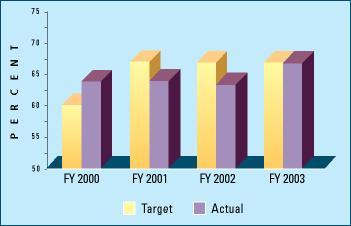
DISCONTINUED MEASURE IN FY 2003: Improve overall customer satisfaction
 D
DDATA VALIDATION AND VERIFICATION
- Data source: Customer surveys.
- Frequency: Surveys are conducted and results are reported annually.
- Data storage: Paper files and contractor electronic files.
- Verification: Internal statistician develops data instrument, conducts survey, and compiles results. Review of results is performed internally by Patents management.
- Data Limitations: None.
| FY 2000 | FY 2001 | FY 2002 | FY 2003 | |
|---|---|---|---|---|
| Target | 60% | 67% | 67% | 67% |
| Actual | 64% | 64% | 63% | 67% met |
Discussion: Target met. The USPTO improved its customer service score four percentage points over FY 2002 and achieved its target. Key drivers of customer satisfaction -- satisfaction with overall search, as well as problem resolution, increased 23 percent and nine percent, respectively. The USPTO has been surveying customers of the patent process since FY 1995.
GOAL: PRODUCTIVITY − Accelerate Processing Times Through Focused Examination
In support of the 21st Century Strategic Plan , the USPTO will reduce patent pendency and substantially cut the size of the work backlog. This will be accomplished through a radical redesign of the entire patent search and examination system based upon multi-examination tracks, greater reliance on commercial service providers, and variable, incentive-driven fees. While the USPTO's long-term patent pendency goal remains 18 months, this goal will not be achieved in the near future because of the higher priority placed on quality and patent e-Gov initiatives. However, USPTO will produce, on average, a first Office action for first-filed U.S. non-provisional applications at the time of 18-month publication. In addition, a patent search report for other patent applications will be issued in the same time frame.
The two primary measures of Patent Organization processing time are: (1) first action pendency, which measures the average time in months until an examiner's initial determination is made of the patentability of an invention; and (2) total pendency, which measures the average time in months until an examiner either allows the patent to issue or the application is abandoned by the applicant.
MEASURE: Reduce average first action pendency (months)
 D
DDATA VALIDATION AND VERIFICATION
- Data source: PALM system.
- Frequency: Daily input, monthly reporting.
- Data storage: PALM, automated systems, reports.
- Verification: Accuracy of supporting data is controlled through internal program edits in the PALM system. Final test for reasonableness is performed internally by patent examiners and supervisory and program management analysts.
- Data Limitations: None.
| FY 2000 | FY 2001 | FY 2002 | FY 2003 | |
|---|---|---|---|---|
| Target | 14.2 | 13.9 | 14.7 | 18.4 |
| Actual | 13.6 | 14.4 | 16.7 | 18.3 met |
Discussion: Target met. The initiatives identified in the USPTO 21st Century Strategic Plan will continue to reduce patent pendency, substantially cut the size of the work backlog, and recover our investments in people, processes, and technology.
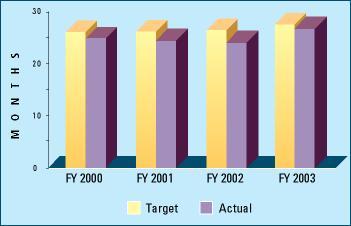
MEASURE: Reduce average total pendency (months)
 D
DDATA VALIDATION AND VERIFICATION
- Data source: PALM system.
- Frequency: Daily input, monthly reporting.
- Data storage: PALM, automated systems, reports.
- Verification: Accuracy of supporting data is controlled through internal program edits in the PALM system. Final test for reasonableness is performed internally by patent examiners and supervisory and program management analysts.
- Data Limitations: None.
| FY 2000 | FY 2001 | FY 2002 | FY 2003 | |
|---|---|---|---|---|
| Target | 26.2 | 26.2 | 26.5 | 27.7 |
| Actual | 25.0 | 24.7 | 24.0 | 26.7 met |
Discussion: Target met. Total pendency is the estimated time in months from filing to issue or abandonment of the application.
NEW MEASURE: Efficiency
 D
DDATA VALIDATION AND VERIFICATION
- Data source: PALM system.
- Frequency: Daily input, quarterly reporting.
- Data storage: PALM, Data Warehouse, Metify Activity Based Management (ABM).
- Verification: Accuracy of supporting data is controlled through internal program edits in PALM, Momentum, Metify ABM. Quality control review of data by Activity Based Cost Accounting (ABC) team and program business teams.
- Data Limitations: None.
| FY 2000 | FY 2001 | FY 2002 | FY 2003 | |
|---|---|---|---|---|
| Target | - | - | - | $3,444 |
| Actual | $2,917 | $3,210 | $3,376 | $3,329 met |
Discussion: Target met. This measure is a relative indicator of the efficiency of the patent process. The measure is calculated by dividing total USPTO expenses associated with the examination and processing of patents (including associated overhead and support expenses) by production units. It should be noted that in prior years, patent output was represented by disposals. That has been changed to production units and all patent measures, both actuals and targets have been recalculated using production units. It should be noted that this measure does not represent the average life cycle cost of a patent since office production units are only one measure of USPTO products and services.
< Go to the Previous Page in the Report | Go to the Next Page in the Report >