a. Synoptic history
The origins of Bud can be traced to a tropical wave that emerged from the
coast of Africa on 22 May. The wave generated little convection as it moved
across the Atlantic and Caribbean. The wave moved into the eastern Pacific
on 6 June, but showed few signs of organization until 11 June when a broad
low pressure area formed a few hundred miles southwest of Acapulco, Mexico.
The initial Dvorak intensity estimates were made that day. Further
development was slow, as the low exhibited multiple centers for much of
11-12 June. As one center emerged as dominant, the system became a tropical
depression near 0600 UTC 13 June about 370 n mi south-southwest of
Manzanillo, Mexico (Table 1).
The depression became Tropical Storm Bud
six hours later as it moved northwestward.
Bud reached a peak intensity of 45 kt early on 14 June while turning
north-northwestward. The peak intensity was maintained for 12 hr, followed
by slow weakening due to a combination of increasing vertical shear and
cooler sea surface temperatures. Bud passed just northeast of Socorro
Island on 15 June as a 40 kt tropical storm. It weakened to a depression on
16 June as it slowed to an erratic drift about 70 n mi north of Socorro
Island. Bud dissipated as a tropical cyclone on 17 June about 90 n mi
north-northeast of Socorro Island; however, the remnant broad low persisted
until 19 June.
b. Meteorological statistics
The "best track" of Bud is given in Table 1
and Figure 1. Figure 2
and Figure 3
show the best track maximum sustained (1 min average) surface (10 m
elevation) wind speed and minimum central pressure, as well as the
associated observations. These include Dvorak satellite technique position
and intensity estimates from the
Tropical Analysis and Forecast Branch (TAFB),
the NOAA/NESDIS Satellite Analysis
Branch (SAB), and the
Air Force Weather Agency (AFWA).
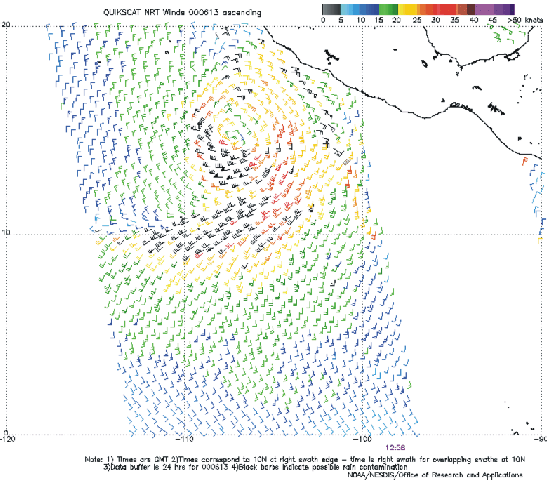
The NASA QuikSCAT satellite provided useful information during Bud. An
overpass near 1256 UTC 13 June, although partly contaminated by rain, showed
that the circulation had become well-defined and that winds were near or at
tropical-storm strength (Fig. 4).
Another overpass near 1256 UTC 17 June
showed that winds had decreased to less than 25 kt. This helped determine
when the cyclone dissipated.
The ship Roger Revelle (call sign KAOU) reported 40 kt winds and a
1001.0 mb pressure at 0000 UTC 14 June. While Socorro Island did not report
tropical storm force winds, it reported a 997.3 mb pressure at 1500 UTC 15
June.
c. Casualty and Damage Statistics
Although Bud passed near Socorro Island, and large waves associated with the
storm likely affected portions of the Mexican coast, there are no reports of
damage or casualties.
d. Forecast and Warning Critique
Since Bud was a tropical storm for less than 72 hr, no verification
statistics are available for that time. The NHC official average track
forecast errors were 44, 83, 133 and 194 n mi at 12 (10 cases), 24 (8
cases), 36 (6 cases) and 48 h (4 cases) respectively. These errors are
considerably worse than the 1990-1999 average of 37, 69, 101 and 132 n mi.
Most of these errors came early in Bud's life, when the official forecasts
failed to catch the turn to the north-northwest. Several objective aids had
lower forecast errors than the official forecast. This included the GFDL and
the GFDN (U.S. Navy version of the GFDL), which were better than the
official forecast at all times.
NHC intensity forecast errors were near the 1990-1999 average at 12 and 24
hr and worse than the average at 36 and 48 hr. There was a positive bias
(winds overforecast) in all the 36 and 48 hr forecasts.
No watches or warnings were issued for Bud.
Table 1.
Best track, Tropical Storm Bud, 13-17 June 2000.
Date/Time
(UTC) | Position |
Pressure
(mb) |
Wind Speed
(kt) | Stage |
| Lat. (°N) | Lon. (°W) |
| 13 / 0600 | 13.1 | 105.9 | 1002 | 30 | tropical depression |
| 13 / 1200 | 13.9 | 106.6 | 1000 | 35 | tropical storm |
| 13 / 1800 | 14.4 | 107.4 | 999 | 40 | " |
| 14 / 0000 | 14.9 | 108.3 | 997 | 45 | " |
| 14 / 0600 | 15.5 | 109.1 | 994 | 45 | " |
| 14 / 1200 | 16.3 | 109.4 | 994 | 45 | " |
| 14 / 1800 | 17.1 | 109.7 | 994 | 45 | " |
| 15 / 0000 | 17.8 | 110.1 | 995 | 40 | " |
| 15 / 0600 | 18.3 | 110.4 | 995 | 40 | " |
| 15 / 1200 | 18.9 | 110.7 | 995 | 40 | " |
| 15 / 1800 | 19.4 | 110.9 | 996 | 40 | " |
| 16 / 0000 | 19.7 | 111.1 | 998 | 35 | " |
| 16 / 0600 | 19.9 | 111.3 | 998 | 35 | " |
| 16 / 1200 | 19.9 | 111.2 | 998 | 30 | tropical depression |
| 16 / 1800 | 19.8 | 111.0 | 998 | 30 | " |
| 17 / 0000 | 19.8 | 110.8 | 998 | 30 | " |
| 17 / 0600 | 19.8 | 110.6 | 1000 | 25 | " |
| 17 / 1200 | 20.2 | 110.5 | 1002 | 25 | " |
| |
| 14 / 0600 | 15.5 | 109.1 | 994 | 45 | minimum pressure |

Figure 1.
Best track positions for Tropical Storm Bud, 13-17 June 2000.
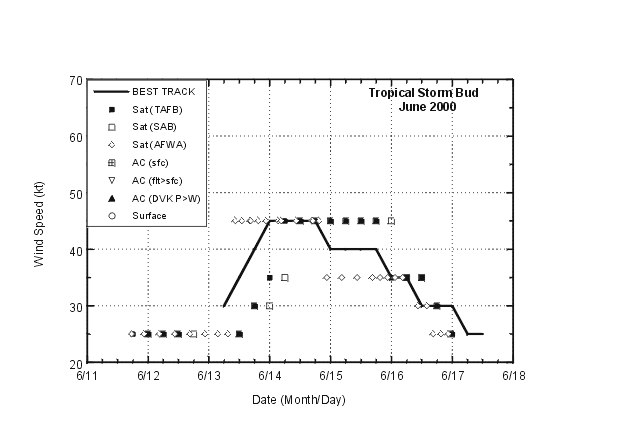
Figure 2.
Best track maximum sustained 1-minute 10 meter wind speed curve for
Tropical Storm Bud, 13-17 June 2000.

Figure 3.
Best track minimum central pressure curve for Tropical Storm Bud, 13-17 June
2000.

Figure 4.
NASA QuikSCAT overpass of Tropical Storm Bud near 1256 UTC 13 June 2000.
Image courtesy of NOAA/NESDIS Marine Observing Systems Team. Black wind
barbs indicate unreliable wind speeds due to rain contamination.
![[NCEP Logo]](graphics/ncep.gif)