Interim Report:
Proposed Recommendations for Action
Historical
This webpage is archived for historical purposes and is no longer being maintained or updated.
A National Public Health Initiative on Diabetes and Women's Health
Return to publication.
Projected trends in prevalence of diagnosed diabetes among women by age, 2000 to 2050
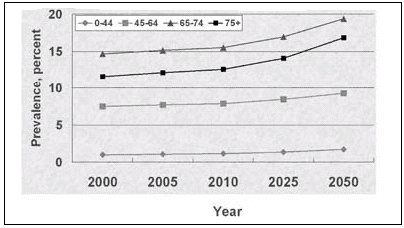
| Years | 0-44 years | 45-64 years | 66-74 years | 75+ years |
|---|---|---|---|---|
| 2000 | 1.01% | 7.49% | 14.66% | 11.67% |
| 2005 | 1.08% | 7.67% | 15.13% | 12.12% |
| 2010 | 1.16% | 7.85% | 15.52% | 12.61% |
| 2025 | 1.37% | 8.43% | 16.95% | 14.09% |
| 2050 | 1.73% | 9.26% | 19.37% | 16.85% |
Source: Diabetes Care, 2001
Return to publication.
Percent of women with annual household income <$25,000.

| Age Group, (Years) | Diabetes | No Diabetes |
|---|---|---|
| 25-24 | 41.3% | 19.7% |
| 45-64 | 33.0% | 18.6% |
| 65+ | 47.8% | 32.9% |
| Unadj. Total | 40.4% | 22.0% |
| Adj. Total | 37.0% | 27.0% |
Adjusted for age, race/ethnicity, marital status, size of
household, and employment status
Source: BRFSS, 2000.
Return to publication.
Trends in Obesity Prevalence among Girls in the United States, 1966-1994
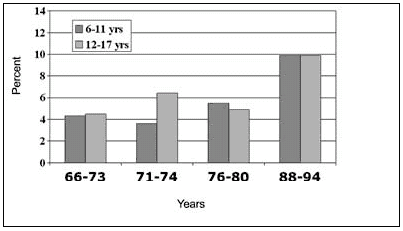
| Years | Age 6-11 years | Age 12-17 years |
|---|---|---|
| 1966-1973 | 4.3% | 4.5% |
| 1971-1974 | 3.6% | 6.4% |
| 1976-1980 | 5.5% | 4.9% |
| 1988-1994 | 9.9% | 9.9% |
Source: Pediatrics, 1998
Return to publication.
Percent of women with less than high school education by age, diabetes status

| Age, years | Diabetes | No Diabetes |
|---|---|---|
| 25-24 | 20.5% | 9.8% |
| 45-64 | 23.7% | 10.4% |
| 65+ | 34.3% | 20.5% |
| Adj. Total+ | 18% | 13% |
Adjusted for age, race/ethnicity, marital status, size of
household, and
employment status.
Source: BRFSS, 2000.
Return to publication.
Contact Us:
- CDC Diabetes Public Inquiries
- 800-CDC-INFO
(800-232-4636)
TTY: (888) 232-6348
8am-8pm ET
Monday-Friday
Closed Holidays - cdcinfo@cdc.gov
