|
Download Data (XLS File) |
|
||||||||
|
||||||||
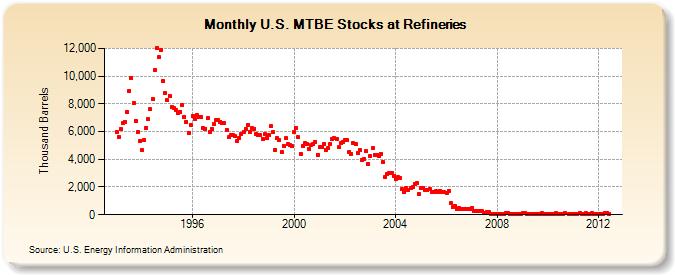
| U.S. MTBE Stocks at Refineries (Thousand Barrels) | ||||||||
| Year | Jan | Feb | Mar | Apr | May | Jun | Jul | Aug | Sep | Oct | Nov | Dec |
|---|---|---|---|---|---|---|---|---|---|---|---|---|
| 1993 | 5,984 | 5,619 | 6,201 | 6,628 | 6,713 | 7,446 | 8,938 | 9,883 | 8,050 | 6,782 | 5,964 | 5,314 |
| 1994 | 4,635 | 5,390 | 6,280 | 6,872 | 7,602 | 8,317 | 10,412 | 11,994 | 11,357 | 11,906 | 9,634 | 8,756 |
| 1995 | 8,247 | 8,597 | 7,756 | 7,735 | 7,549 | 7,331 | 7,441 | 7,932 | 7,081 | 6,701 | 5,930 | 6,458 |
| 1996 | 7,151 | 6,901 | 7,210 | 7,019 | 7,030 | 6,273 | 6,214 | 6,948 | 6,003 | 6,204 | 6,563 | 6,832 |
| 1997 | 6,807 | 6,718 | 6,607 | 6,594 | 6,134 | 5,586 | 5,725 | 5,716 | 5,649 | 5,300 | 5,561 | 5,849 |
| 1998 | 5,955 | 6,207 | 6,486 | 6,000 | 6,223 | 6,210 | 5,843 | 5,771 | 5,751 | 5,494 | 5,822 | 5,501 |
| 1999 | 5,736 | 6,366 | 5,934 | 4,694 | 5,509 | 5,384 | 4,527 | 4,985 | 5,501 | 5,092 | 5,002 | 4,940 |
| 2000 | 5,954 | 6,224 | 5,583 | 4,406 | 4,950 | 5,143 | 5,119 | 4,729 | 5,056 | 5,116 | 5,259 | 4,343 |
| 2001 | 4,855 | 4,911 | 5,113 | 4,668 | 4,817 | 5,075 | 5,435 | 5,533 | 5,473 | 4,852 | 5,168 | 5,280 |
| 2002 | 5,426 | 5,359 | 4,552 | 4,382 | 5,141 | 5,115 | 4,467 | 4,648 | 3,962 | 3,989 | 4,568 | 3,648 |
| 2003 | 4,258 | 4,784 | 4,330 | 4,314 | 4,229 | 4,385 | 3,800 | 2,755 | 2,936 | 2,983 | 3,000 | 2,770 |
| 2004 | 2,588 | 2,704 | 2,670 | 1,824 | 1,657 | 1,938 | 1,799 | 1,930 | 1,978 | 2,246 | 2,269 | 1,489 |
| 2005 | 1,899 | 1,948 | 1,792 | 1,751 | 1,866 | 1,646 | 1,641 | 1,691 | 1,646 | 1,719 | 1,673 | 1,605 |
| 2006 | 1,579 | 1,717 | 814 | 550 | 661 | 414 | 513 | 427 | 420 | 386 | 413 | 396 |
| 2007 | 485 | 272 | 232 | 236 | 253 | 232 | 150 | 183 | 168 | 85 | 36 | 46 |
| 2008 | 55 | 74 | 85 | 74 | 120 | 151 | 58 | 48 | 84 | 69 | 61 | 67 |
| 2009 | 88 | 107 | 87 | 67 | 47 | 54 | 25 | 31 | 52 | 90 | 76 | 47 |
| 2010 | 81 | 53 | 60 | 56 | 89 | 51 | 38 | 79 | 92 | 79 | 24 | |
| 2011 | 28 | 56 | 67 | 114 | 67 | 65 | 103 | 86 | 67 | 89 | 53 | 58 |
| 2012 | 61 | 27 | 72 | 110 | 116 | 87 | 114 | |||||
| - = No Data Reported; -- = Not Applicable; NA = Not Available; W = Withheld to avoid disclosure of individual company data. |
| Release Date: 9/27/2012 |
| Next Release Date: Last Week of October 2012 |