|
Download Data (XLS File) |
|
||||||||
|
||||||||
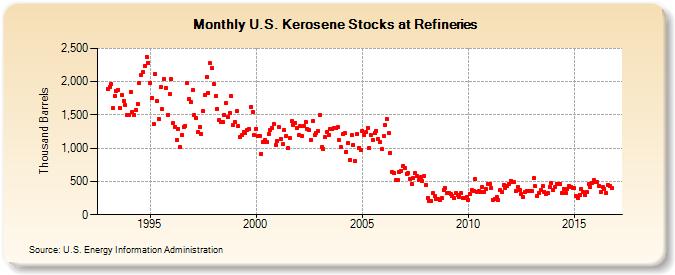
| U.S. Kerosene Stocks at Refineries (Thousand Barrels) | ||||||||
| Year | Jan | Feb | Mar | Apr | May | Jun | Jul | Aug | Sep | Oct | Nov | Dec |
|---|---|---|---|---|---|---|---|---|---|---|---|---|
| 1993 | 1,894 | 1,924 | 1,961 | 1,602 | 1,791 | 1,861 | 1,880 | 1,600 | 1,801 | 1,706 | 1,644 | 1,504 |
| 1994 | 1,500 | 1,847 | 1,543 | 1,506 | 1,578 | 1,671 | 1,987 | 2,098 | 2,147 | 2,235 | 2,371 | 2,287 |
| 1995 | 1,984 | 1,760 | 1,364 | 2,113 | 1,707 | 1,437 | 1,916 | 1,584 | 2,038 | 1,906 | 1,503 | 1,812 |
| 1996 | 2,034 | 1,376 | 1,322 | 1,125 | 1,289 | 1,015 | 1,201 | 1,318 | 1,340 | 1,976 | 1,738 | 1,689 |
| 1997 | 1,873 | 1,502 | 1,459 | 1,240 | 1,313 | 1,215 | 1,555 | 1,793 | 2,064 | 1,828 | 2,274 | 2,200 |
| 1998 | 1,960 | 1,781 | 1,590 | 1,418 | 1,392 | 1,399 | 1,500 | 1,675 | 1,464 | 1,530 | 1,783 | 1,349 |
| 1999 | 1,396 | 1,554 | 1,333 | 1,172 | 1,194 | 1,248 | 1,230 | 1,275 | 1,282 | 1,624 | 1,543 | 1,200 |
| 2000 | 1,294 | 1,178 | 1,185 | 917 | 1,088 | 1,126 | 1,088 | 1,213 | 1,279 | 1,305 | 1,364 | 1,045 |
| 2001 | 1,107 | 1,314 | 1,143 | 1,061 | 1,274 | 1,182 | 999 | 1,153 | 1,404 | 1,349 | 1,386 | 1,305 |
| 2002 | 1,191 | 1,326 | 1,189 | 1,334 | 1,397 | 1,294 | 1,273 | 1,122 | 1,403 | 1,194 | 1,225 | 1,259 |
| 2003 | 1,498 | 1,011 | 989 | 1,165 | 1,240 | 1,200 | 1,292 | 1,293 | 1,296 | 1,296 | 1,314 | 1,117 |
| 2004 | 1,011 | 1,212 | 1,227 | 949 | 1,079 | 819 | 1,192 | 1,049 | 806 | 1,207 | 996 | 976 |
| 2005 | 1,264 | 1,200 | 1,236 | 1,305 | 1,002 | 1,201 | 1,129 | 1,226 | 1,264 | 1,135 | 1,095 | 984 |
| 2006 | 1,184 | 1,344 | 1,432 | 1,224 | 935 | 643 | 622 | 521 | 519 | 649 | 661 | 729 |
| 2007 | 702 | 617 | 628 | 544 | 467 | 552 | 623 | 579 | 528 | 560 | 510 | 577 |
| 2008 | 453 | 258 | 207 | 211 | 323 | 278 | 233 | 233 | 219 | 249 | 366 | 397 |
| 2009 | 323 | 329 | 306 | 288 | 246 | 324 | 298 | 272 | 324 | 251 | 247 | 268 |
| 2010 | 227 | 316 | 370 | 357 | 536 | 347 | 360 | 345 | 415 | 339 | 383 | 464 |
| 2011 | 463 | 406 | 223 | 239 | 263 | 224 | 368 | 340 | 449 | 401 | 431 | 462 |
| 2012 | 511 | 487 | 488 | 358 | 413 | 366 | 312 | 271 | 335 | 362 | 355 | 362 |
| 2013 | 351 | 546 | 425 | 281 | 323 | 372 | 431 | 348 | 307 | 331 | 424 | 477 |
| 2014 | 375 | 416 | 462 | 462 | 467 | 332 | 383 | 326 | 382 | 434 | 415 | 400 |
| 2015 | 397 | 274 | 253 | 302 | 394 | 340 | 289 | 338 | 457 | 417 | 483 | 517 |
| 2016 | 486 | 487 | 439 | 345 | 415 | 385 | 330 | 453 | 438 | 403 | ||
| - = No Data Reported; -- = Not Applicable; NA = Not Available; W = Withheld to avoid disclosure of individual company data. |
| Release Date: 12/30/2016 |
| Next Release Date: 1/31/2017 |