|
Download Data (XLS File) |
|
||||||||
|
||||||||
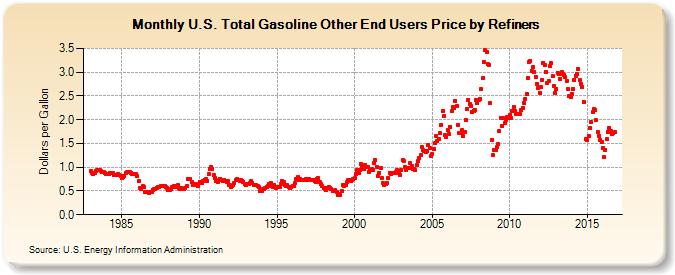
| U.S. Total Gasoline Other End Users Price by Refiners (Dollars per Gallon) | ||||||||
| Year | Jan | Feb | Mar | Apr | May | Jun | Jul | Aug | Sep | Oct | Nov | Dec |
|---|---|---|---|---|---|---|---|---|---|---|---|---|
| 1983 | 0.929 | 0.883 | 0.849 | 0.887 | 0.913 | 0.932 | 0.949 | 0.941 | 0.917 | 0.906 | 0.895 | 0.873 |
| 1984 | 0.862 | 0.864 | 0.861 | 0.887 | 0.886 | 0.869 | 0.846 | 0.834 | 0.841 | 0.854 | 0.846 | 0.811 |
| 1985 | 0.782 | 0.787 | 0.822 | 0.874 | 0.892 | 0.891 | 0.893 | 0.873 | 0.848 | 0.849 | 0.861 | 0.854 |
| 1986 | 0.808 | 0.703 | 0.557 | 0.538 | 0.595 | 0.575 | 0.480 | 0.478 | 0.488 | 0.462 | 0.468 | 0.476 |
| 1987 | 0.528 | 0.542 | 0.539 | 0.571 | 0.587 | 0.585 | 0.609 | 0.614 | 0.600 | 0.602 | 0.588 | 0.556 |
| 1988 | 0.519 | 0.530 | 0.531 | 0.574 | 0.595 | 0.593 | 0.608 | 0.615 | 0.572 | 0.547 | 0.561 | 0.532 |
| 1989 | 0.547 | 0.561 | 0.598 | 0.753 | 0.762 | 0.748 | 0.685 | 0.618 | 0.655 | 0.652 | 0.619 | 0.613 |
| 1990 | 0.695 | 0.680 | 0.663 | 0.708 | 0.737 | 0.748 | 0.713 | 0.856 | 0.971 | 1.006 | 0.968 | 0.827 |
| 1991 | 0.781 | 0.703 | 0.685 | 0.721 | 0.757 | 0.721 | 0.701 | 0.737 | 0.706 | 0.694 | 0.701 | 0.635 |
| 1992 | 0.592 | 0.613 | 0.630 | 0.671 | 0.725 | 0.749 | 0.721 | 0.709 | 0.725 | 0.711 | 0.695 | 0.646 |
| 1993 | 0.635 | 0.640 | 0.647 | 0.676 | 0.700 | 0.677 | 0.634 | 0.630 | 0.616 | 0.613 | 0.574 | 0.504 |
| 1994 | 0.506 | 0.537 | 0.538 | 0.569 | 0.584 | 0.612 | 0.636 | 0.673 | 0.601 | 0.584 | 0.623 | 0.558 |
| 1995 | 0.577 | 0.579 | 0.585 | 0.646 | 0.709 | 0.683 | 0.616 | 0.607 | 0.616 | 0.583 | 0.569 | 0.583 |
| 1996 | 0.600 | 0.598 | 0.658 | 0.743 | 0.790 | 0.728 | 0.752 | 0.734 | 0.732 | 0.733 | 0.750 | 0.737 |
| 1997 | 0.755 | 0.745 | 0.726 | 0.732 | 0.738 | 0.708 | 0.692 | 0.758 | 0.764 | 0.694 | 0.654 | 0.601 |
| 1998 | 0.562 | 0.549 | 0.525 | 0.553 | 0.581 | 0.557 | 0.541 | 0.495 | 0.495 | 0.520 | 0.475 | 0.421 |
| 1999 | 0.430 | 0.420 | 0.495 | 0.629 | 0.608 | 0.624 | 0.678 | 0.720 | 0.725 | 0.715 | 0.736 | 0.752 |
| 2000 | 0.769 | 0.849 | 0.948 | 0.871 | 0.946 | 1.058 | 1.007 | 0.961 | 1.051 | 1.006 | 1.011 | 0.906 |
| 2001 | 0.935 | 0.956 | 0.950 | 1.091 | 1.143 | 1.013 | 0.822 | 0.888 | 0.989 | 0.763 | 0.672 | 0.617 |
| 2002 | 0.655 | 0.657 | 0.774 | 0.883 | 0.864 | 0.875 | 0.882 | 0.878 | 0.891 | 0.933 | 0.876 | 0.840 |
| 2003 | 0.934 | 1.143 | 1.132 | 1.003 | 0.931 | 0.983 | 0.985 | 1.078 | 1.023 | 0.971 | 0.955 | 0.933 |
| 2004 | 1.049 | 1.122 | 1.197 | 1.251 | 1.415 | 1.357 | 1.341 | 1.329 | 1.340 | 1.471 | 1.399 | 1.234 |
| 2005 | 1.280 | 1.383 | 1.509 | 1.649 | 1.559 | 1.587 | 1.714 | 1.878 | 2.178 | 2.077 | 1.669 | 1.636 |
| 2006 | 1.775 | 1.702 | 1.853 | 2.177 | 2.269 | 2.248 | 2.390 | 2.283 | 1.883 | 1.725 | 1.713 | 1.777 |
| 2007 | 1.657 | 1.746 | 1.988 | 2.224 | 2.421 | 2.338 | 2.288 | 2.151 | 2.189 | 2.214 | 2.416 | 2.347 |
| 2008 | 2.408 | 2.434 | 2.640 | 2.875 | 3.209 | 3.464 | 3.426 | 3.162 | 3.157 | 2.345 | 1.574 | 1.259 |
| 2009 | 1.365 | 1.361 | 1.418 | 1.485 | 1.753 | 2.034 | 1.876 | 2.034 | 1.926 | 1.993 | 2.049 | 2.032 |
| 2010 | 2.099 | 2.035 | 2.190 | 2.276 | 2.174 | 2.129 | 2.118 | 2.123 | 2.127 | 2.202 | 2.254 | 2.358 |
| 2011 | 2.445 | 2.549 | 2.872 | 3.213 | 3.233 | 3.027 | 3.101 | 3.005 | 2.906 | 2.756 | 2.659 | 2.567 |
| 2012 | 2.690 | 2.839 | 3.202 | 3.150 | 3.006 | 2.773 | 2.816 | 3.126 | 3.186 | 2.917 | 2.712 | 2.560 |
| 2013 | 2.647 | 2.991 | 2.953 | 2.862 | 3.005 | 2.966 | 2.946 | 2.907 | 2.823 | 2.635 | 2.502 | 2.487 |
| 2014 | 2.547 | 2.648 | 2.844 | 2.929 | 2.954 | 3.059 | 2.838 | 2.761 | 2.688 | 2.378 | W | 1.591 |
| 2015 | 1.564 | 1.652 | 1.829 | 1.943 | 2.152 | 2.222 | 2.207 | 1.992 | 1.737 | 1.662 | 1.577 | 1.520 |
| 2016 | 1.411 | 1.210 | 1.367 | 1.587 | 1.746 | 1.820 | 1.760 | 1.708 | 1.717 | 1.735 | ||
| - = No Data Reported; -- = Not Applicable; NA = Not Available; W = Withheld to avoid disclosure of individual company data. |
| Release Date: 1/3/2017 |
| Next Release Date: 2/1/2017 |