|
Download Data (XLS File) |
|
||||||||
|
||||||||
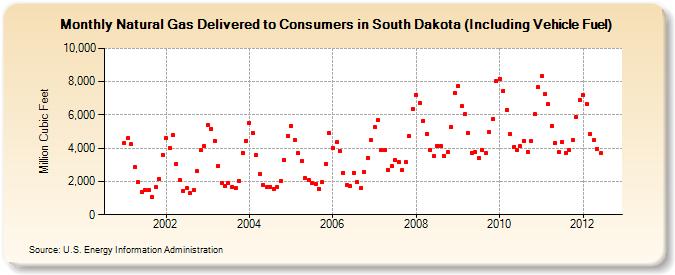
| Natural Gas Delivered to Consumers in South Dakota (Including Vehicle Fuel) (Million Cubic Feet) | ||||||||
| Year | Jan | Feb | Mar | Apr | May | Jun | Jul | Aug | Sep | Oct | Nov | Dec |
|---|---|---|---|---|---|---|---|---|---|---|---|---|
| 2001 | 4,302 | 4,607 | 4,228 | 2,845 | 1,940 | 1,381 | 1,492 | 1,496 | 1,058 | 1,661 | 2,126 | 3,617 |
| 2002 | 4,603 | 4,036 | 4,766 | 3,060 | 2,078 | 1,454 | 1,619 | 1,300 | 1,471 | 2,623 | 3,873 | 4,121 |
| 2003 | 5,421 | 5,156 | 4,455 | 2,953 | 1,928 | 1,710 | 1,882 | 1,675 | 1,591 | 2,054 | 3,715 | 4,455 |
| 2004 | 5,515 | 4,940 | 3,584 | 2,439 | 1,808 | 1,650 | 1,686 | 1,576 | 1,638 | 1,998 | 3,307 | 4,743 |
| 2005 | 5,319 | 4,504 | 3,722 | 3,219 | 2,207 | 2,079 | 1,880 | 1,845 | 1,562 | 1,943 | 3,073 | 4,906 |
| 2006 | 4,013 | 4,348 | 3,843 | 2,535 | 1,775 | 1,716 | 2,525 | 1,955 | 1,584 | 2,584 | 3,428 | 4,503 |
| 2007 | 5,252 | 5,707 | 3,865 | 3,918 | 2,716 | 2,923 | 3,270 | 3,154 | 2,669 | 3,142 | 4,726 | 6,332 |
| 2008 | 7,209 | 6,706 | 5,662 | 4,850 | 3,894 | 3,529 | 4,142 | 4,148 | 3,546 | 3,750 | 5,286 | 7,304 |
| 2009 | 7,741 | 6,517 | 6,027 | 4,913 | 3,716 | 3,777 | 3,405 | 3,875 | 3,692 | 4,949 | 5,725 | 8,039 |
| 2010 | 8,184 | 7,439 | 6,300 | 4,842 | 4,063 | 3,880 | 4,109 | 4,444 | 3,789 | 4,403 | 6,039 | 7,651 |
| 2011 | 8,319 | 7,250 | 6,634 | 5,363 | 4,309 | 3,781 | 4,384 | 3,718 | 3,866 | 4,487 | 5,871 | 6,905 |
| 2012 | 7,195 | 6,643 | 4,838 | 4,465 | 3,973 | 3,686 | ||||||
| - = No Data Reported; -- = Not Applicable; NA = Not Available; W = Withheld to avoid disclosure of individual company data. |
| Release Date: 8/31/2012 |
| Next Release Date: 9/28/2012 |