|
Download Data (XLS File) |
|
||||||||
|
||||||||
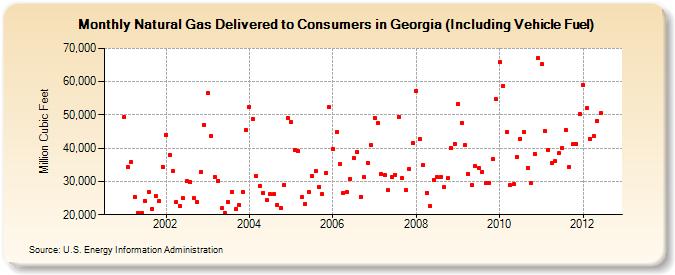
| Natural Gas Delivered to Consumers in Georgia (Including Vehicle Fuel) (Million Cubic Feet) | ||||||||
| Year | Jan | Feb | Mar | Apr | May | Jun | Jul | Aug | Sep | Oct | Nov | Dec |
|---|---|---|---|---|---|---|---|---|---|---|---|---|
| 2001 | 49,414 | 34,292 | 35,867 | 25,368 | 20,633 | 20,544 | 24,229 | 26,863 | 21,857 | 25,679 | 23,983 | 34,450 |
| 2002 | 44,041 | 37,992 | 33,260 | 23,775 | 22,612 | 24,924 | 30,113 | 29,701 | 24,899 | 23,785 | 32,829 | 47,106 |
| 2003 | 56,470 | 43,704 | 31,355 | 30,232 | 21,920 | 20,512 | 23,789 | 26,828 | 21,628 | 22,981 | 26,920 | 45,508 |
| 2004 | 52,486 | 48,806 | 31,529 | 28,718 | 26,610 | 24,562 | 26,132 | 26,093 | 22,927 | 22,025 | 29,012 | 49,125 |
| 2005 | 47,756 | 39,503 | 39,085 | 25,191 | 23,198 | 26,957 | 31,619 | 33,089 | 28,453 | 26,199 | 32,483 | 52,399 |
| 2006 | 39,904 | 45,015 | 35,118 | 26,670 | 26,891 | 30,790 | 36,980 | 38,808 | 25,412 | 31,321 | 35,677 | 40,816 |
| 2007 | 49,163 | 47,589 | 32,236 | 31,955 | 27,318 | 31,415 | 32,039 | 49,457 | 31,028 | 27,420 | 33,851 | 41,413 |
| 2008 | 57,281 | 42,777 | 34,804 | 26,663 | 22,574 | 30,576 | 31,233 | 31,449 | 28,207 | 30,900 | 40,166 | 41,352 |
| 2009 | 53,365 | 47,708 | 40,809 | 32,388 | 28,948 | 34,499 | 33,996 | 32,876 | 29,455 | 29,641 | 36,652 | 54,673 |
| 2010 | 65,906 | 58,803 | 44,837 | 28,800 | 29,148 | 37,424 | 42,844 | 44,775 | 34,171 | 29,527 | 38,368 | 67,079 |
| 2011 | 65,198 | 45,044 | 39,593 | 35,475 | 36,016 | 38,534 | 40,194 | 45,594 | 34,423 | 41,125 | 41,248 | 50,158 |
| 2012 | 59,004 | 51,936 | 42,860 | 43,672 | 48,178 | 50,467 | ||||||
| - = No Data Reported; -- = Not Applicable; NA = Not Available; W = Withheld to avoid disclosure of individual company data. |
| Release Date: 8/31/2012 |
| Next Release Date: 9/28/2012 |