| Petroleum (Thousand Barrels per Day) |
2011 |
2012 |
| |
|
30 Year History |
Norway |
Europe |
OECD |
World |
Rank |
Norway |
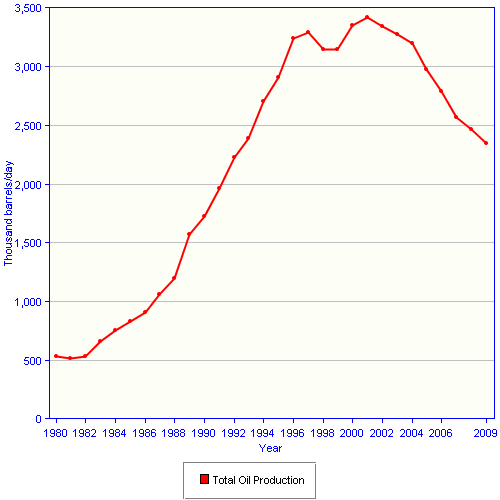
| Total Oil Production |

Production of crude oil (including lease condensate), natural gas plant liquids, and other liquids, and refinery processing gain (loss). Negative value indicates refinery processing loss. |

|
2,007.35 |
4,273 |
21,639 |
87,110 |
14 |
|
| Crude Oil Production |
Includes lease condensate. |

|
1,752.24 |
3,418 |
14,948 |
74,126 |
15 |
|
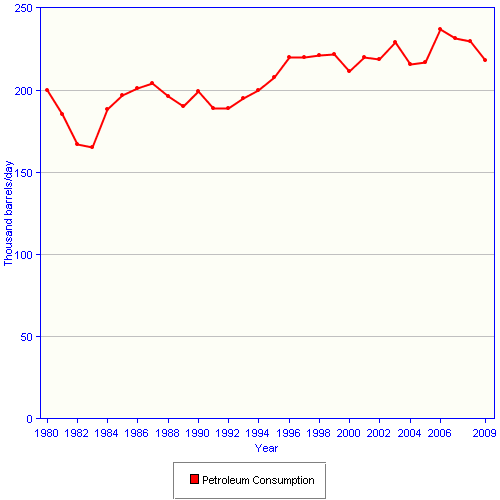
| Consumption |
Consumption of petroleum products and direct combustion of crude oil. |

|
255.17 |
15,033 |
45,877 |
87,421 |
50 |
|
| Net Export/Imports(-) |
Net Exports = Total Oil Production – Consumption. Negative numbers are Net Imports. |

|
1,752.18 |
-10,759 |
-24,238 |
-- |
203 |
NA |
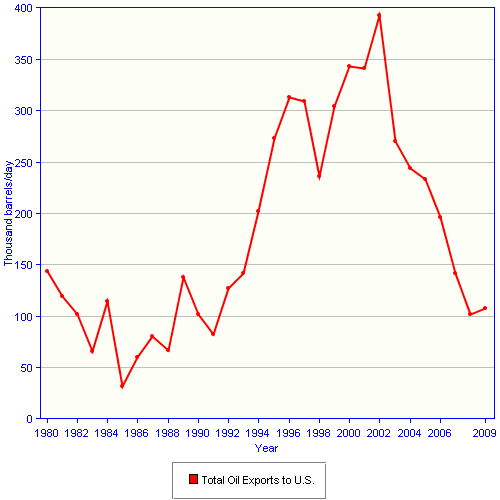
| Total Oil Exports to U.S. |
Total crude oil and petroleum products. |

|
NA |
|
NA |
|
NA |
NA |
| Refinery Capacity |
Crude oil distillation capacity as of January 1. Sources: U.S. data from EIA; Other countries from Oil & Gas Journal. |

|
319 |
16,787 |
45,873 |
88,097 |
47 |
319 |
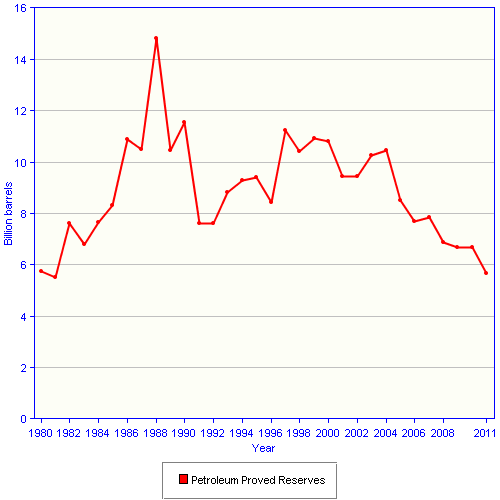
| Proved Reserves(Billion Barrels) |
As of January 1. Sources: U.S. data from EIA; Other countries from Oil & Gas Journal. |

|
5.67 |
12 |
############## |
############## |
21 |
5.32 |
| Natural Gas (Billion Cubic Feet) |
2010 |
2011 |
| |
|
29 Year History |
Norway |
Europe |
World |
Rank |
|
Norway |
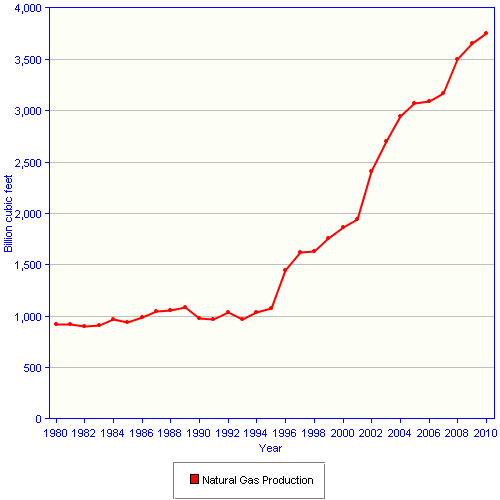
| Production |
Dry natural gas. |

|
3,756 |
10,830 |
111,845 |
6 |
|
3,641 |
| Consumption |
Dry natural gas. |

|
203 |
20,638 |
112,607 |
54 |
|
170 |
| Net Export/Imports(-) |
Net Exports = Exports - Imports. Negative numbers are Net Imports. Note: Data range begins with the year 1990. |

|
3,552 |
-9,725 |
-- |
89 |
|
NA |
Proved Reserves
(Trillion Cubic Feet) |
As of January 1. Sources: U.S. data from EIA; Other countries from Oil & Gas Journal. |

|
82 |
166 |
NA |
16 |
|
72 |
| Coal (Million Short Tons) |
2009 |
2010 |
| |
|
|
Norway |
Europe |
World |
Rank |
|
Norway |
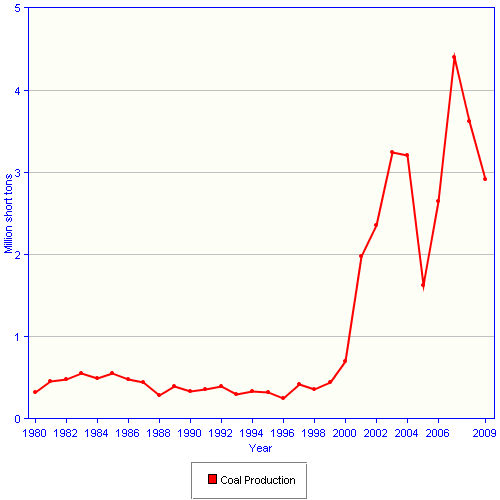
| Production |
Production of primary coal (includes anthracite, bituminous, lignite, and for Estonia, oil shale). |

|
2.911 |
755 |
7,546 |
45 |
|
2.133 |
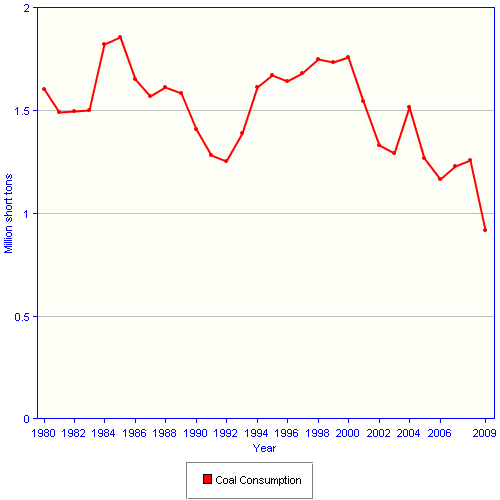
| Consumption |
Consumption of primary coal (includes anthracite, bituminous, lignite, and for Estonia, oil shale) and net imports of metallurgical coke. |

|
0.917 |
964 |
7,318 |
68 |
|
1.375 |
| Net Export/Imports(-) |
Net Exports = Exports – Imports. Negative numbers are Net Imports. Includes primary coal and metallurgical coke. |

|
1.867 |
-220 |
-- |
95 |
|
0.585 |
| Electricity (Billion Kilowatthours) |
2008 |
2009 |
| |
|
|
Norway |
Europe |
World |
Rank |
|
Norway |
| Net Generation |
Conventional thermal electricity, hydroelectric power, nuclear electric power, and geothermal, solar, wind, and wood and waste electric power generation. |

|
139.19 |
3,607 |
19,104 |
25 |
|
129.87 |
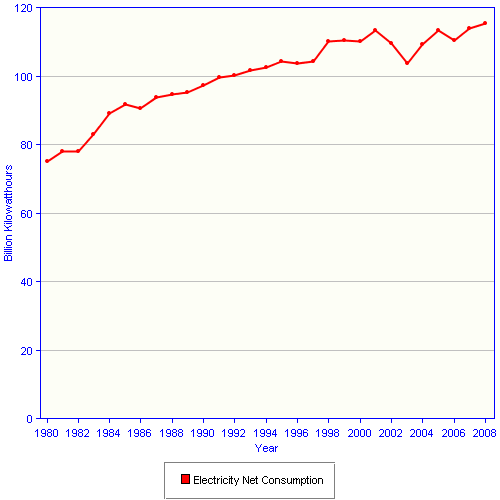
| Net Consumption |
Net generation+electricty imports-electricity exports-electricity distribution losses. |

|
115.62 |
3,364 |
17,420 |
26 |
|
110.80 |
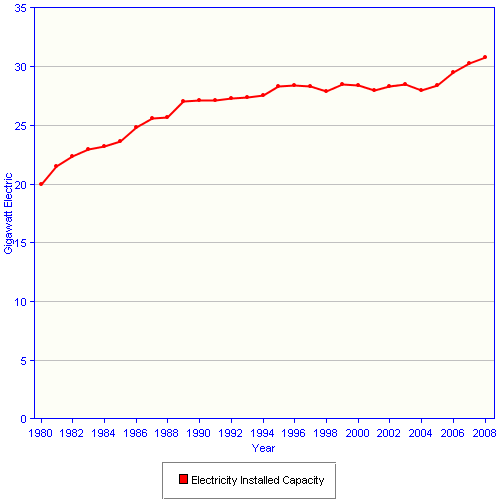
| Installed Capacity (GWe) |
One billion watts or one thousand megawatts of electric capacity, as of January 1. |

|
30.56 |
916 |
4,635 |
27 |
|
30.95 |
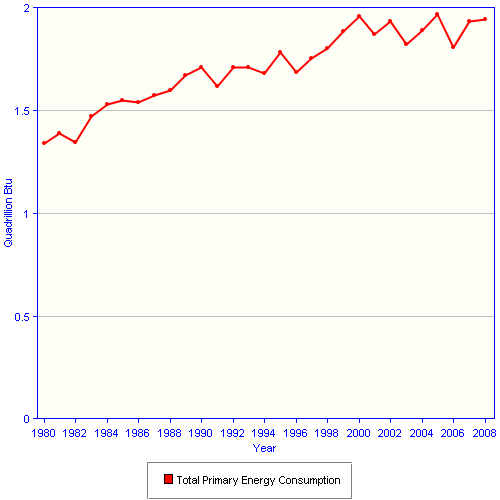
| Total Primary Energy (Quadrillion Btu) |
2008 |
2009 |
| |
|
|
Norway |
Europe |
World |
Rank |
|
Norway |
| Production |
Production of petroleum (crude oil and natural gas plant liquids), dry natural gas, and coal, and net generation of hydroelectric, nuclear, and geothermal, solar, wind, and wood and waste electric power. |

|
10.125 |
46 |
489 |
10 |
|
9.886 |
| Consumption |
Consumption of petroleum, dry natural gas, and coal, and net hydroelectric, nuclear, and geothermal, solar, wind, and wood and waste electricity. Also includes net electricty imports. |

|
1.942 |
86 |
491 |
37 |
|
1.901 |
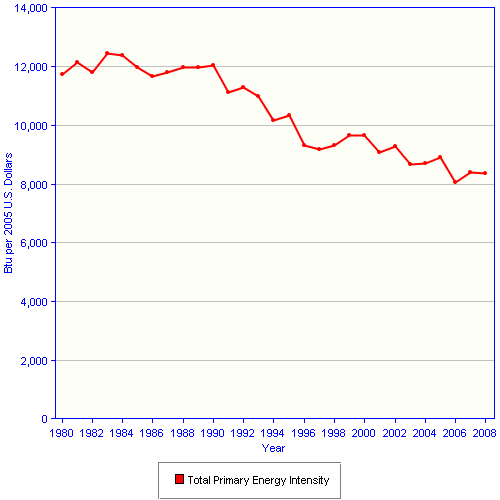
Energy Intensity
(Btu per 2005 U.S. Dollars) |
Consumption per dollar of gross domestic product using purchasing power parities. |

|
8,367 |
5,482 |
7,454 |
50 |
|
8,297 |
| Carbon Dioxide Emissions (Million Metric Tons of CO₂) |
2009 |
2010 |
| |
|
|
Norway |
Europe |
World |
Rank |
|
Norway |
| Total from Consumption of Fossil Fuels |
Emissions from the consumption of petroleum, natural gas, and coal and the flaring of natural gas. |

|
43.49 |
4,314 |
29,778 |
66 |
|
41.80 |

