U.S. Department of Commerce

Newsroom

Skip top of page navigation

Dr. Robert Groves Appeared on C-SPAN's "Washington Journal": Women in the Workforce

View archived segment on C-SPAN Link to a non-federal Web site

Census Bureau Director Robert Groves appeared on C-SPAN's "Washington Journal" on Friday, August 12, discussing women in the workforce.

Director's Blog

Presentation [PDF]

Slide 2: Subject Definitions [PDF]

Slide 3: Number of Full-Time, Year-Round Workers With Earnings by Sex: 1967 to 2009
Slide 3:
Number of Full-Time, Year-Round Workers With Earnings by Sex: 1967 to 2009 [PDF]
Slide 4: Median Earnings of Full-Time, Year-Round Workers by Sex:  1960 to 2009
Slide 4:
Median Earnings of Full-Time, Year-Round Workers by Sex: 1960 to 2009 [PDF]
Ratio of Women's-to-Men's Median Earnings for Full-Time, Year-Round Workers: 1960 to 2009
Slide 5:
Ratio of Women's-to-Men's Median Earnings for Full-Time, Year-Round Workers: 1960 to 2009 [PDF]
Slide 6: Ratio of Women's to Men's Median Earnings in Selected Occupations for Full-Time, Year-Round Workers: 2007-2009
Slide 6:
Ratio of Women's to Men's Median Earnings in Selected Occupations for Full-Time, Year-Round Workers: 2007-2009 [PDF]
Slide 7: Usual Hours Worked by Sex: 1975-2010
Slide 7:
Usual Hours Worked by Sex: 1975-2010 [PDF]
Slide 8: Major Occupation Groups by Percentage of Mothers of Preschoolers Opting Out of the Labor Force: 2009
Slide 8:
Major Occupation Groups by Percentage of Mothers of Preschoolers Opting Out of the Labor Force: 2009 [PDF]
Slide 9: Percentage of Men and Women with a Bachelor's Degree or More, Ages 25 and Older: 1940 to 2010
Slide 9:
Percentage of Men and Women with a Bachelor's Degree or More, Ages 25 and Older: 1940 to 2010 [PDF]
Slide 10: Percentage of Men and Women with a Bachelor's Degree or More, Ages 25 to 29:  1940 to 2010
Slide 10:
Percentage of Men and Women with a Bachelor's Degree or More, Ages 25 to 29: 1940 to 2010 [PDF]
Slide 11: Percentage of Managers Who Are Women: 1940-2009
Slide 11:
Percentage of Managers Who Are Women: 1940-2009 [PDF]
Slide 12: Percentage of Women-Owned Businesses:1997, 2002, and 2007
Slide 12:
Percentage of Women-Owned Businesses:1997, 2002, and 2007 [PDF]
Slide 13: Percentage of Employees in Women-Owned Firms: 1997, 2002 and 2007
Slide 13:
Percentage of Employees in Women-Owned Firms: 1997, 2002 and 2007 [PDF]
Slide 14: Percentage of Firms by Sales/Receipts Levels by Sex of Owner: 2007
Slide 14:
Percentage of Firms by Sales/Receipts Levels by Sex of Owner: 2007 [PDF]
Slide 15: Industries with Relatively High and Low Women Ownership
Slide 15:
Industries with Relatively High and Low Women Ownership [PDF]
Slide 16: Educational Attainment of Owners of Respondent Firms by Sex: 2007
Slide 16: Educational Attainment of Owners of Respondent Firms by Sex: 2007 [PDF]
Slide 17: Average Hours Worked Per Week by Owners of Respondent Firms by Sex: 2007
Slide 17:
Average Hours Worked Per Week by Owners of Respondent Firms by Sex: 2007 [PDF]

Census Bureau Reports:

Employment and Labor Force Participation
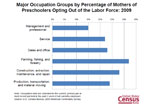
Earnings

Other Reports and Information
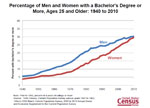
Sources for the information:

Women-Owned Businesses in the 21st Century

Economics and Statistics Administration Reports:

Note: The Bureau of Labor Statistics releases substantial information on working women:


[PDF] or PDF denotes a file in Adobe’s Portable Document Format. To view the file, you will need the Adobe® Reader® Off Site available free from Adobe. This symbol Off Site indicates a link to a non-government web site. Our linking to these sites does not constitute an endorsement of any products, services or the information found on them. Once you link to another site you are subject to the policies of the new site.

Source: U.S. Census Bureau | Public Information Office | PIO@census.gov | Last Revised: August 31, 2012