
Focus on Prices and Spending | Consumer Expenditure | Volume 2, Number 12
Consumer Spending in 2010
On the basis of data from the Consumer Expenditure Survey (CE), consumers spent less in 2010, compared with 2009, on almost all major components of the household budget. Average annual expenditures per consumer unit (CU)[1] fell 2.0 percent, and average annual income before taxes dropped 0.6 percent, the second consecutive yearly decline for both of these measures. (See table 1.)
Overview of Spending
- Entertainment expenditures, which tend to be more discretionary, fell 7.0 percent in 2010, the most in percentage terms of any category. All subcomponents of entertainment spending fell, with fees and admissions spending reduced by 7.5 percent.
- Overall food spending decreased 3.8 percent. Spending on food away from home fell more than spending on food at home, 4.4 percent versus 3.4 percent, respectively. Consumers spent 6.9 percent less on going out to dinner, a subcomponent of food away from home, in 2010.
- Mortgage interest payments and charges, a subcomponent of housing, fell 6.8 percent, evidence of the continued weakness of the housing market in the nation.
- Donations to charities and other organizations fell 23.4 percent, and charitable giving to churches and religious organizations dropped 8.8 percent.
- Healthcare, one of two major spending components that increased, rose 1.0 percent. The 2.6-percent jump in health insurance spending, a subcomponent of healthcare, fueled the healthcare increase.
- The 0.2-percent increase in transportation spending was driven by a 7.3-percent rise in gasoline and motor oil expenditures.
Although the latest US economic recession officially ended in June 2009,[2] lasting effects were felt throughout the economy in 2010. The drop in spending can be attributed to many factors, including faltering consumer confidence, high unemployment rates, and a depressed housing market. According to the Nielsen Company, consumer confidence in the United States sagged throughout 2010. The Nielsen Consumer Confidence Index, which is reported quarterly, indexed U.S. consumer confidence at 81 for the final two quarters of 2010, the lowest confidence level for U.S. consumers during the year. (Levels above an index of 100 indicate degrees of optimism.)[3] The monthly national unemployment rate, as measured by the Current Population Survey (CPS), never fell below 9.4 percent in 2010. This was the first calendar year since the CPS started collecting employment data in 1948[4] that the monthly unemployment rate was above 9.0 percent every month. Sales of new and existing homes fell for the fourth consecutive year.[5] Foreclosure filings, which include default notices, scheduled auctions, and bank repossessions, were levied on a record 2.9 million U.S. properties.[6]
| Item | 2008 | 2009 | 2010 | Percent change | |
|---|---|---|---|---|---|
| 2008–2009 | 2009–2010 | ||||
Income before taxes |
$63,563 | $62,857 | $62,481 | -1.1 | -0.6 |
Average annual expenditures |
50,486 | 49,067 | 48,109 | -2.8 | -2.0 |
Food |
6,443 | 6,372 | 6,129 | -1.1 | -3.8 |
At home |
3,744 | 3,753 | 3,624 | 0.2 | -3.4 |
Away from home |
2,698 | 2,619 | 2,505 | -2.9 | -4.4 |
Housing |
17,109 | 16,895 | 16,557 | -1.3 | -2.0 |
Apparel and services |
1,801 | 1,725 | 1,700 | -4.2 | -1.4 |
Transportation |
8,604 | 7,658 | 7,677 | -11.0 | 0.2 |
Healthcare |
2,976 | 3,126 | 3,157 | 5.0 | 1.0 |
Entertainment |
2,835 | 2,693 | 2,504 | -5.0 | -7.0 |
Cash contributions |
1,737 | 1,723 | 1,633 | -0.8 | -5.2 |
Personal insurance and pensions |
5,605 | 5,471 | 5,373 | -2.4 | -1.8 |
All other expenditures |
3,376 | 3,404 | 3,379 | 0.8 | -0.7 |
| Source: Bureau of Labor Statistics, Consumer Expenditure Survey | |||||
Spending highlights
CE data have reflected several medium- to long-term spending trends in the U.S. economy:
- For CUs which indicated that they were homeowners, mortgage interest and charges, a subcategory of housing, has been declining since 2007. The spending level in 2010 was 13.1 percent less than the level in 2007 ($5,042, versus $5,799). This drop in spending is evidence of the decline in the housing market and the resulting lower interest rates and increasing foreclosure rate. The CE also measured fewer homeowner CUs in 2010 than in 2007 (79.5 million versus 80.2 million).
- Advances in technology have changed the spending habits of many Americans. For example, the level of spending on cellular phone services has been on the rise, increasing from $210 in 2001 to $760 in 2010, while the level for residential phone services has declined, dropping from $686 in 2001 to $401 in 2010. (See chart 1.)
- Computer ownership also has been on the rise. In 2001, the percentage of CUs owning a personal computer was 54 percent. By 2010, the percentage had climbed to 79 percent, a 25-percentage-point increase in the 10-year period. Along with the increase in the number of CUs owning a computer, the average number of personal computers owned within a household more than doubled during the period, from 0.62 in 2001 to 1.29 in 2010. The increase in computer ownership, coupled with increases in Internet access expenditures, could be one reason spending on reading materials, including newspapers, magazines, and books, has declined from $141 in 2001 to $100 in 2010.

Other interesting spending patterns can be analyzed by breaking the 2010 data down by socioeconomic characteristics:
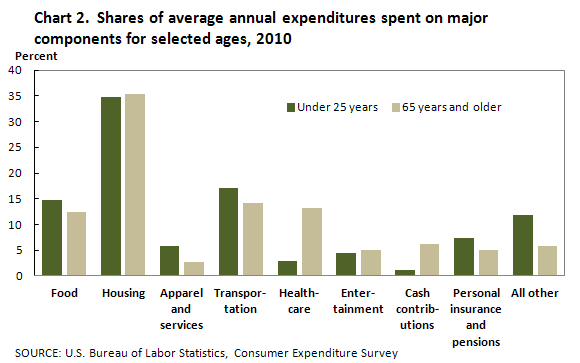
- CUs with a reference person[7] 65 years and older allocated 13.2 percent of their total expenditures to healthcare, compared with 2.8 percent allocated by CUs with a reference person under 25 years of age. (See chart 2.) This difference in percent allocated shows why the aging population is much more vulnerable to increases in healthcare costs. The healthcare expenditure level also is much higher for older CUs: $4,843 for the 65-and-older group versus $775 for the under-25-years group. The under-25-years cohort also allocates much less of its spending to cash contributions, relative to the 65-years-and-older group: 1.1 percent versus 6.2 percent, respectively. Cash contributions include donations to churches, charities, and other organizations. The personal insurance and pensions component makes up 7.4 percent of the under-25-years group budget and only 5.1 percent for the 65-years-and-older group.
- The CUs in the two lowest quintiles of income before taxes[8] allocated a relatively small share of their expenditures to pensions and Social Security, compared with those in the highest two income quintiles. Less than 5 percent is allocated by each of the lowest two quintiles, while more than 11 percent is allocated by each of the highest two. This difference could be because a higher proportion of students and retirees are in the lowest income quintiles.[9]
For more information on the availability of current or earlier CE tabular data or microdata, contact the Division of Consumer Expenditure Survey, Bureau of Labor Statistics, 2 Massachusetts Avenue, NE., Room 3985, Washington, DC 20212-0001. Telephone: (202) 691-6000. Email: cexinfo@bls.gov. Online: http://www.bls.gov/cex/.
Notes
[1] Consumer units include families, single persons living alone or sharing a household with others but who are financially independent, or two or more persons living together who share expenses.
[2] For more information on U.S. business cycles, see National Bureau of Economic Research, "U.S. Business Cycle Expansions and Contractions," http://www.nber.org/cycles.html.
[3] For more information, visit http://www.nielsen.com/content/dam/corporate/us/en/reports-downloads/2011-Reports/GlobalConsumerConfidenceReport_Q42010.pdf?wwparam=1319752536.
[4] For more information, see BLS Handbook of Methods, Chapter 1, "Labor Force Data Derived from the Current Population Survey" (Bureau of Labor Statistics, Apr. 17, 2003), http://www.bls.gov/opub/hom/homch1_a.htm.
[5] For more information, see "New and Existing Home Sales, U.S." (National Association of Home Builders), http://www.nahb.org/fileUpload_details.aspx?contentID=55761&fromGSA=1.
[6] For more information, see "Record 2.9 million U.S. Properties Receive Foreclosure Filings in 2010 Despite 30-Month Low in December" (RealtyTrac, October 2011), http://www.realtytrac.com/content/press-releases/record-29-million-us-properties-receive-foreclosure-filings-in-2010-despite-30-month-low-in-december-6309?wwparam=1320935470.
[7] The reference person is the first member mentioned by the respondent when asked to "Start with the name of the person or one of the persons who owns or rents the home." It is with respect to this person that the relationship of the other consumer unit members is determined.
[8] For each period represented in the tables, complete income reporters are ranked in ascending order according to the level of total before-tax income reported by the consumer unit. The ranking is then divided into five equal groups.
[9] For more information, see "Table 1. Quintiles of income before taxes: Average annual expenditures and characteristics, Consumer Expenditure Survey, 2010" (U.S. Bureau of Labor Statistics, September 2011), http://www.bls.gov/cex/2010/Standard/quintile.pdf.