May 05, 2010 (The Editor’s Desk is updated each business day.)
Industry shifts put Philadelphia on a new road to job growth
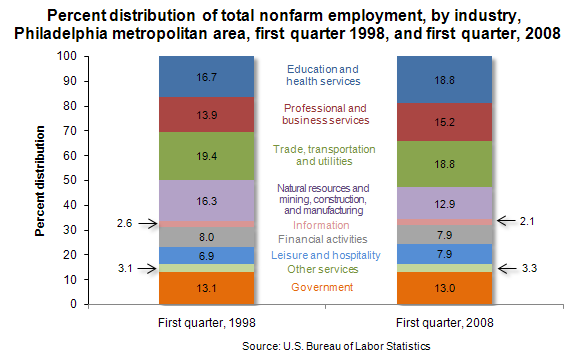
Once a traditional metropolitan area with the largest percentage of jobs concentrated in the trade, transportation, and utilities industry, Philadelphia has transformed itself into a leader in the education and health services industry.
[Chart data]
In the first quarter of 1998, the trade, transportation, and utilities industry accounted for the largest percentage of employment (19.4 percent) in the Philadelphia metropolitan area, followed by education and health services (16.7 percent). By the first quarter of 2008, the percentage of jobs in the trade, transportation, and utilities industry had decreased to 18.8 percent of the Philadelphia workforce, while the percentage employed in the education and health services industry had increased to 18.8 percent. The increase in the percentage employed within the education and health services industry enabled the industry to join trade, transportation, and utilities as the area's top employer, with both industries employing more than a half-million workers.
Professional and business services, the highest paying industry in the area, remained in third place over the course of the decade, though it did strengthen its share of the workforce, which rose from 13.9 percent to 15.2 percent. The industry also distanced itself from the fourth-ranked employer, government, whose share of employment in 2008 (13.0 percent) was virtually unchanged from 10 years earlier.
These data are from the Quarterly Census of Employment and Wages program. To learn more, see "Industry shifts over the decade put Philadelphia on a new road to job growth," (PDF) in the Monthly Labor Review, April 2010 issue.
Related TED articles
Metropolitan areas and counties |
Employment
Of interest
Spotlight on Statistics: National Hispanic Heritage Month
In this Spotlight, we take a look at the Hispanic labor force—including labor force participation, employment and unemployment, educational attainment, geographic location, country of birth, earnings, consumer expenditures, time use, workplace injuries, and employment projections.
.
Read more »