Short-Term Energy Outlook
Release Date: September 11, 2012 | Next Release Date: October 10, 2012 | Full Report | Text Only | All Tables | All Figures
Electricity
U.S. Electricity Consumption
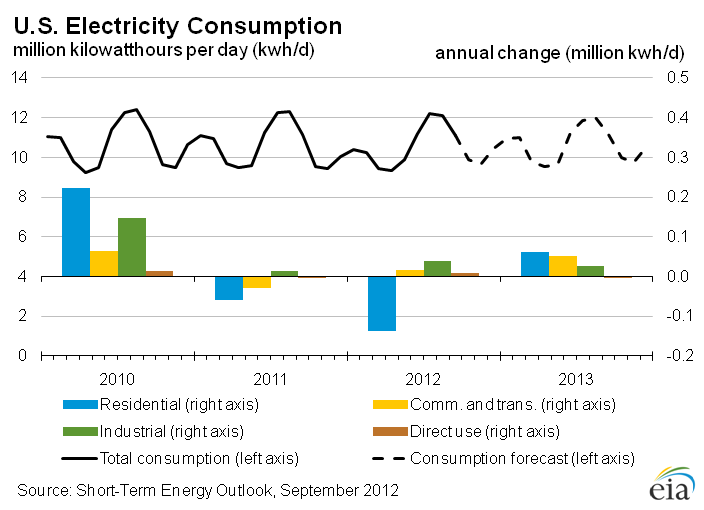
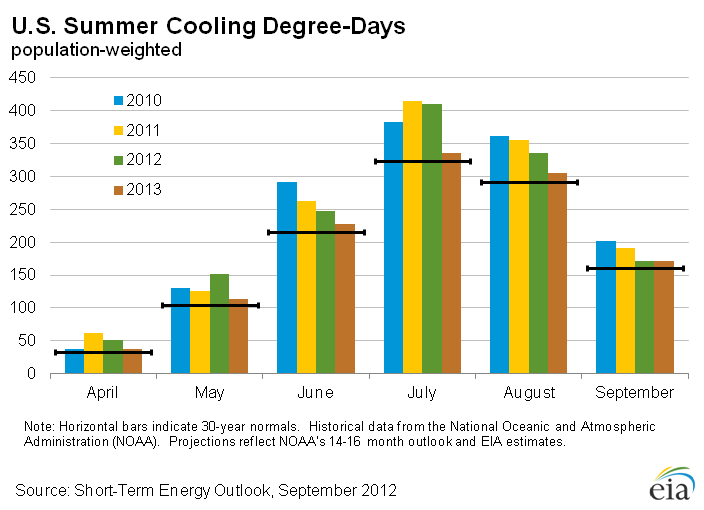
Average daily retail sales of electricity to the residential sector during the first half of this year were about 6.6 percent lower than the same period in 2011, as a result of mild winter temperatures in the south where many households heat using electricity. Although summer temperatures this year were much warmer than normal, cooling degree days during June, July and August were about 4 percent lower than last summer. Residential sales for the entire year are projected to average about 3.5 percent lower than sales during 2011. Projected sales of electricity to the residential sector grow by 1.6 percent in 2013.
U.S. Electricity Generation
Recent power generation and fuel cost data indicate that over the last few quarters the generation fuel mix has been much more responsive to changes in relative fossil fuel prices than it has been in past years (see Fuel Competition in Power Generation and Elasticities of Substitution). The share of total generation fueled by natural gas during the first half of 2012 averaged 30.4 percent compared with 22.3 percent during the same period last year. This increase in fuel share was driven by a cost of natural gas that was very low relative to the cost of coal. However, in June, the average Henry Hub natural gas spot price surpassed the average spot price for Central Appalachian coal for the first time since October 2011, indicating that the recent trend of substituting coal-fired generation with natural-gas-fired generation may be slowing and will likely reverse. In light of the data indicating that power generators have recently been more responsive to changes in relative fuel costs, EIA has revised its projections for the generation fuel mix during 2013. EIA now expects that the higher natural gas prices next year will lead to a 9.5-percent decline in natural gas-fired generation while coal-fired generation increases by 9.3 percent.

U.S. Electricity Retail Prices
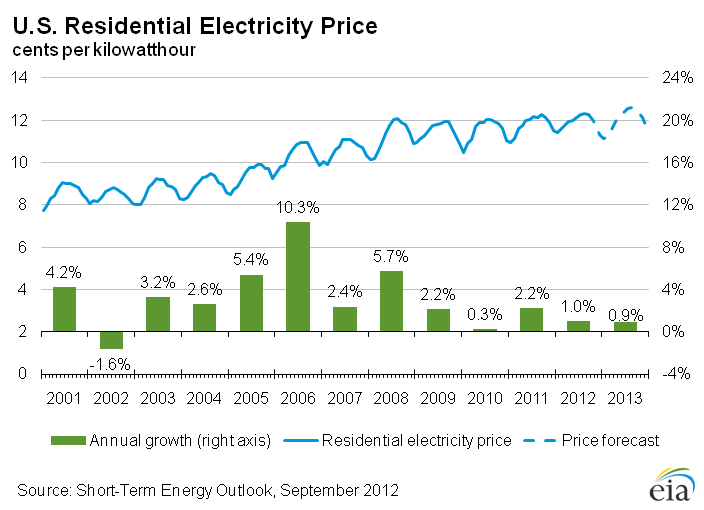
EIA expects the nominal U.S. residential electricity price will rise by 1.0 percent during 2012 to an average of 11.91 cents per kilowatthour. During 2013, U.S. residential retail electricity prices increase 0.9 percent over the average 2012 price. When measured in real terms, the U.S. residential electricity price declines by an annual average of 0.8 percent in both 2012 and 2013.
| U.S. Electricity Summary | ||||
|---|---|---|---|---|
| 2010 | 2011 | 2012 projected | 2013 projected | |
| Retail Prices | (cents per kilowatt hour) | |||
| Residential Sector | 11.54 | 11.79 | 11.91 | 12.02 |
| Commercial Sector | 10.19 | 10.32 | 10.15 | 10.28 |
| Industrial Sector | 6.77 | 6.89 | 6.68 | 6.75 |
| Power Generation Fuel Costs | (dollars per million Btu) | |||
| Coal | 2.27 | 2.40 | 2.39 | 2.39 |
| Natural Gas | 5.09 | 4.71 | 3.38 | 4.04 |
| Residual Fuel Oil | 12.57 | 18.49 | 19.74 | 18.05 |
| Distillate Fuel Oil | 16.60 | 22.40 | 23.38 | 22.94 |
| Generation | (billion kwh per day) | |||
| Coal | 5.061 | 4.751 | 4.182 | 4.570 |
| Natural Gas | 2.706 | 2.785 | 3.403 | 3.079 |
| Nuclear | 2.211 | 2.165 | 2.096 | 2.136 |
| Conventional Hydroelectric | 0.713 | 0.891 | 0.764 | 0.749 |
| Renewable (non-hydroelectric) | 0.458 | 0.534 | 0.593 | 0.646 |
| Total Generation | 11.302 | 11.249 | 11.154 | 11.296 |
| Retail Sales | (billion kwh per day) | |||
| Residential Sector | 3.96 | 3.90 | 3.76 | 3.83 |
| Commercial Sector | 3.64 | 3.61 | 3.63 | 3.68 |
| Industrial Sector | 2.66 | 2.67 | 2.71 | 2.74 |
| Total Retail Sales | 10.29 | 10.21 | 10.13 | 10.27 |
| Primary Assumptions | (percent change from previous year) | |||
| Real DIsposable Personal Income | 1.8 | 1.3 | 1.5 | 1.8 |
| Manufacturing Production Index | 6.3 | 4.8 | 4.9 | 2.5 |
| Cooling Degree-days | 17.2 | 2.0 | -0.8 | -12.9 |
| Heating Degree-days | -0.6 | -3.4 | -10.2 | 14.2 |
| Number of Households | 0.8 | 0.8 | 1.1 | 1.2 |
Interactive Data Viewers
Provides custom data views of historical and forecast data
STEO Custom Table Builder ›
Real Prices Viewer ›
| Related Articles | ||
|---|---|---|
| Today In Energy | Daily | |
| Annual Energy Outlook Electric Power Projections | Annual | |
| Annual Energy Outlook Levelized Generation Costs | Annual | |
| Change in STEO Regional and U.S. Degree Day Calculations | Sep-2012 | |
| Changes to Electricity and Renewables Tables | Aug-2012 | |
| Fuel Competition in Power Generation | Jun-2012 | |
| 2011-2012 Winter Fuels Outlook Slideshow | Oct-2011 |