‹ Analysis & Projections
Short-Term Energy Outlook
Release Date: September 11, 2012 | Next Release Date: October 10, 2012 | Full Report | Text Only | All Tables | All Figures
Highlights
- Brent crude oil spot prices have increased at a relatively steady pace from their 2012 low of $89 per barrel on June 25 to their recent high of $117 per barrel on August 23 because of the seasonal tightening of oil markets and continuing unexpected production outages. EIA expects Brent crude oil prices to fall from recent highs over the rest of 2012, averaging $111 per barrel over the last 4 months of 2012 and $103 per barrel in 2013. West Texas Intermediate (WTI) crude oil spot prices rose by a more modest $17 per barrel between June 25 and August 23, as the WTI discount to Brent crude oil widened from $10 per barrel to $22 per barrel. EIA expects WTI spot prices to average $93 per barrel in 2013, with the WTI discount to Brent narrowing to $9 per barrel by the end of the 2013.
- Higher crude oil prices, refinery outages, a pipeline disruption, and concerns over Hurricane Isaac's impact on the Gulf Coast, the United States' major refining region, contributed to higher gasoline prices during August. EIA has increased the average regular-gasoline retail price forecast for the third quarter of 2012 to $3.66 per gallon from $3.49 per gallon in last month's Outlook. EIA expects retail gasoline prices to begin declining later this month as the gasoline market recovers and transitions from summer-grade to winter-grade gasoline specifications. Forecast regular gasoline retail prices average $3.58 per gallon over the fourth quarter of 2012 and $3.43 per gallon in 2013.
- EIA expects U.S. total crude oil production to average 6.3 million barrels per day (bbl/d) in 2012, an increase of 0.7 million bbl/d from last year. Projected U.S. domestic crude oil production increases to 6.8 million bbl/d in 2013, the highest level of production since 1993.
- Because of the projected increase in natural gas prices relative to coal, EIA expects the recent trend of substituting coal-fired electricity generation with natural gas generation to slow and likely reverse over the next year. From April through August 2012, average monthly natural gas prices to electric generators increased by 34 percent, while coal prices fell slightly. EIA expects that coal-fired electricity generation will increase by 9 percent in 2013, while natural gas generation will fall by about 10 percent.
- EIA expects carbon dioxide emissions from fossil fuels, which fell by 2.3 percent in 2011, to further decline by 2.4 percent in 2012. However, projected emissions increase by 2.8 percent in 2013, as coal regains some of its electric-power-generation market share.
- Natural gas working inventories ended August 2012 at an estimated 3.4 trillion cubic feet (Tcf), about 13 percent above the same time last year. EIA expects the Henry Hub natural gas spot price, which averaged $4.00 per million British thermal units (MMBtu) in 2011, to average $2.65 per MMBtu in 2012 and $3.34 per MMBtu in 2013.
| Price Summary | ||||
|---|---|---|---|---|
| 2010 | 2011 | 2012 projected | 2013 projected | |
|
a West Texas Intermediate. b Average regular pump price. c On-highway retail. d U.S. Residential average. |
||||
|
WTI Crude Oila
(dollars per barrel) |
79.40 | 94.86 | 95.66 | 92.63 |
|
Brent Crude Oil
(dollars per barrel) |
79.51 | 111.26 | 111.81 | 103.38 |
|
Gasolineb
(dollars per gallon) |
2.78 | 3.53 | 3.64 | 3.43 |
|
Dieselc
(dollars per gallon) |
2.99 | 3.84 | 3.96 | 3.73 |
|
Heating Oild
(dollars per gallon) |
2.95 | 3.68 | 3.77 | 3.69 |
|
Natural Gasd
(dollars per thousand cubic feet) |
11.37 | 11.01 | 10.90 | 11.09 |
|
Electricityd
(cents per kilowatt hour) |
11.54 | 11.79 | 11.91 | 12.02 |
Interactive Data Viewers
Provides custom data views of historical and forecast data
STEO Custom Table Builder ›
Real Prices Viewer ›
| Related Tables | |||||||
|---|---|---|---|---|---|---|---|
| Table SF01. U.S. Motor Gasoline Summer Outlook | |||||||
| Table 1. U.S. Energy Markets Summary | |||||||
| Table 2. U.S. Energy Prices | |||||||
| Table 9b. U.S. Regional Macroeconomic Data | |||||||
| Table 9c. U.S. Regional Weather Data | |||||||
| Related Figures | |||||||
|---|---|---|---|---|---|---|---|
| U.S. Annual Energy Expenditures | XLS | PNG | |||||
| U.S. Summer Cooling Degree-Days | XLS | PNG | |||||
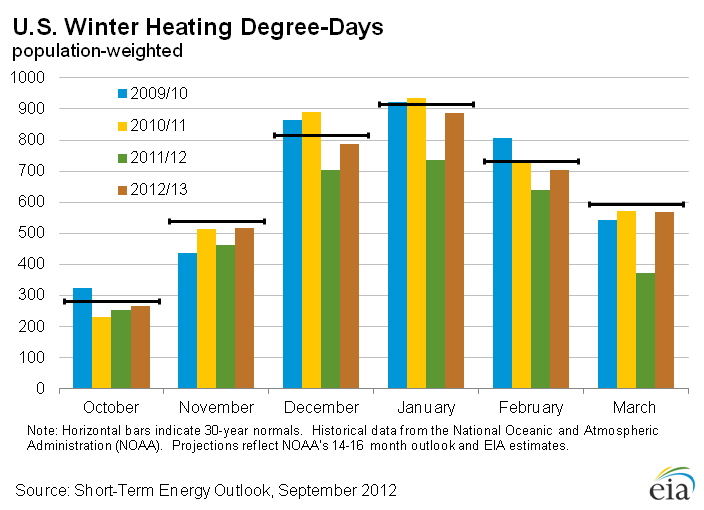
| U.S. Winter Heating Degree-Days | XLS | PNG | |||||
| U.S. Census Regions and Census Divisions | XLS | PNG | |||||
| Related Articles | ||
|---|---|---|
| Today In Energy | Daily | |
| 2012 Summer Transportation Fuels Outlook Slideshow | Apr-2012 |