Science Features

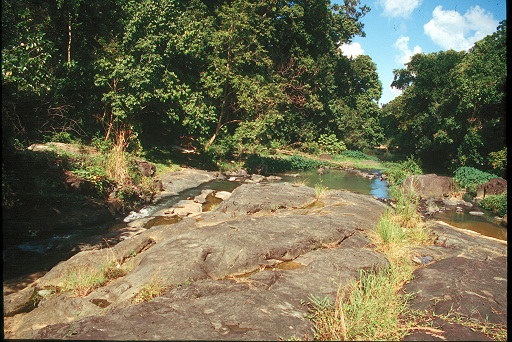
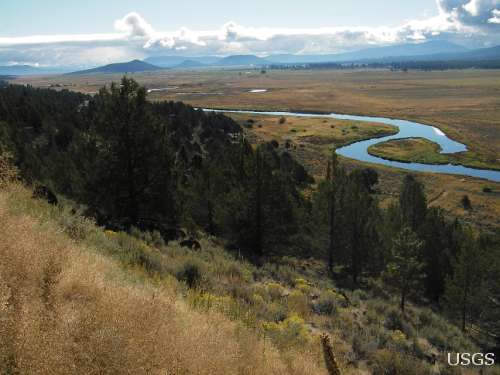
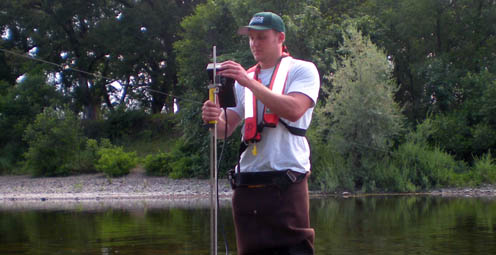
The Arkansas River at Great Bend, Kansas, on July 13, 2012. Lying west of Isaac’s rain reach, the river was drier still on September 10.
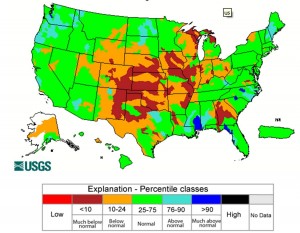
More than three quarters of the contiguous United States still faces abnormally dry conditions in spite of scattered relief from rains generated by tropical storm system Isaac. As seen on the U.S. Drought Monitor, exceptional drought — the worst category — persists in the very center of the nation from Nebraska south to Texas, east through Missouri and Arkansas to the Mississippi Valley. Much of Georgia is also in exceptional drought.
Drought: the slow but costly disaster
Drought is the nation’s most costly natural disaster, far exceeding earthquakes, tornados, hurricanes and floods. FEMA has estimated that the annual average cost of drought in the United States ranges from $6 to $8 billion. (By comparison, the annual costs of flooding are in the $2 to $4 billion range.) Unlike flooding, drought does not come and go in a single episode. Rather, it often takes a long time for drought to begin to impact an area, and it can fester for months or even years.
In order to reduce the impacts of drought, governments and managers rely on objective and unbiased scientific information about trends in streamflow, precipitation, and other factors that contribute to drought, so that they can understand where drought is occurring, how long it is likely to impact an area, and where drought is likely to strike next.
What about Isaac’s effects on the current drought?
The obvious question comes from both expert and casual observers: What difference did tropical system Isaac make in drought-stricken areas?
NOAA records show that Hurricane Isaac made landfall in southern Louisiana the evening of August 28 and then tracked north-northwest, losing its tropical character over Missouri on September 1 and then merging with another frontal zone to move on into the Ohio Valley. This NASA graphic of rainfall based on satellite measurements shows that Isaac’s rainfall was concentrated to the east of its tropical storm center. (100 mm is about 4 in. of rain.)
One week after Isaac officially dissipated (9/1), this real-time map of national stream flow from USGS WaterWatch (below normal 7-day average streamflow compared to historical streamflow, updated 9/8) shows that streamflows have returned to normal or higher levels in the middle and lower Mississippi Valleys and the Ohio Valley where much of Isaac’s related precipitation fell.
However, while real-time streamflow levels from USGS WaterWatch are an essential aspect of measuring drought, stream and river conditions are not the only drought indicator.
Drought is a bigger concept than streamflow can show
The national Drought Monitor is the official report detailing drought conditions. This complex map service paints a fuller picture of drought than just stream flow information. In addition to relying heavily on USGS streamgage data, this map also incorporates soil moisture, agricultural information, satellite data, and precipitation.
The map — a joint product of NOAA, the U.S. Department of Agriculture, and the National Drought Mitigation Center — is prepared in consultation with scientists from several agencies, including the USGS. It portrays a comprehensive geographic assessment of areas experiencing drought, as well as the severity of drought. This map has important economic significance because it is used by many states as the basis for declaring a drought emergency and requesting federal funding.
You can see that, according to the U.S. Drought Monitor (updated 9/4), extreme or severe levels of drought persist in parts of Arkansas, Missouri, Tennessee, Kentucky, Illinois, Indiana, and Ohio — states to which Isaac’s rains did come in varied amounts.
The next obvious question might be: Why didn’t Isaac make more of a difference in the drought?
That’s a complex inquiry that involves lots of issues like precipitation rates and volumes, water runoff, groundwater levels, and soil moisture. Let’s look for a broader answer in a story about accumulated precipitation deficit that’s no less true for its simplicity.
A Story of Drought: The Water Bank
USGS WaterWatch map of monthly-average streamflow for August 2012. Note how rain from Isaac accelerated the monthly average east of New Orleans.
It can be useful to think of drought as a water bank account held by Mother Nature. When it rains, Mother Nature makes a deposit into Earth’s water bank account. When it stops raining, Mother Nature is obliged to withdraw water from the soil and from vegetation for “payment” to the atmosphere; this is done through evapotranspiration. The longer she goes without making water deposits, the greater the amount of water that gets withdrawn from the soil, as well as from other storage accounts like lakes and reservoirs, and the greater her water deposits (i.e., precipitation) will have to be to bring the account back up to what it was before the drought started.
That’s essentially what’s going on when one huge storm system with its sudden rains seems to make little immediate difference in a drought. Mother Nature may have hit the million-dollar lottery with Isaac and is making big deposits into her terrestrial account. But she needs to make two or three more deposits like this to get back to the starting point of local average conditions of water deposits and withdrawals.
Looking ahead on drought
In addition to the U.S. Drought Monitor, which tracks current and historic drought conditions, every month the National Weather Service produces a Drought Outlook, with bi-weekly updates based primarily on precipitation forecasts.
The latest long-range report, released on September 6 and looking ahead to November 30, indicates that drought is likely to develop, persist, or intensify across much of the Great Plains (including Texas but not the Dakotas) and all or parts of the Rocky Mountain and Western states (excluding Arizona and Washington).

U.S. Seasonal Drought Outlook, Sept. 6 – Nov. 30. NOAA forecast.
Drought conditions are likely to improve in Louisiana, Alabama, the Dakotas, the upper Mississippi Valley, and the Ohio Valley. Arkansas, western Tennessee, and Georgia will see lesser degrees of improvement.
Links and resources
For local details and impacts related to drought, please contact your State Climatologist or Regional Climate Center.

While Hurricane Isaac has passed, scientific work to understand the storm’s impact on Gulf Coast states continues. Read more
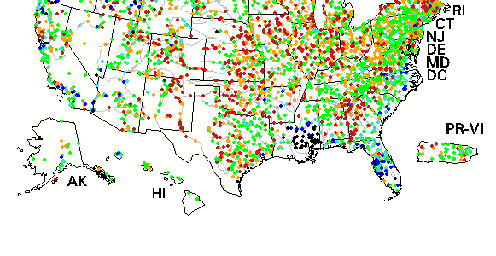
Real-time map showing the extent of flooding (black dots) and drought (red dots) in the U.S. Read more

USGS scientists, engineers, and technicians are working along the Gulf coast in response to Hurricane Isaac. Read more

The U.S. Geological Survey is keeping careful watch as Tropical Storm Isaac continues to track northwest toward the west coast of Florida and the Gulf of Mexico. Read more
Fifteen years of data illuminate complex interactions driving land change in Puerto Rico. Read more

USGS scientists look to see if water quality is improving. Read more

The majority of the nation is facing dry conditions; in most areas drought conditions are expected to persist or intensify. Read more

Kati is a USGS student employee studying water and traveling the California coast. Read more

This year, a large dead zone again threatens the Gulf of Mexico. Read more

Please comment on the USGS’ draft science strategies! Read more
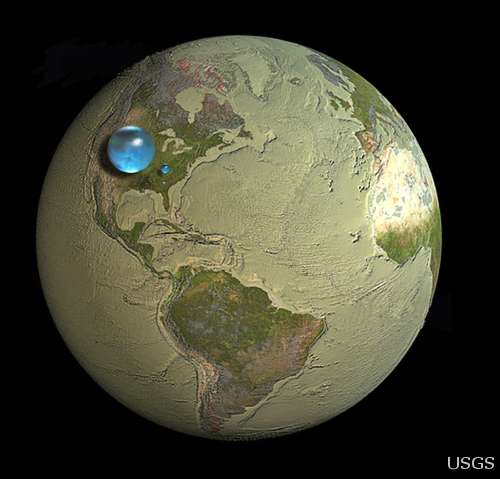
Are you surprised the water bubbles look so small? Read more
USGS Details how climate change could affect water availability in 14 U.S. Basins. Read more
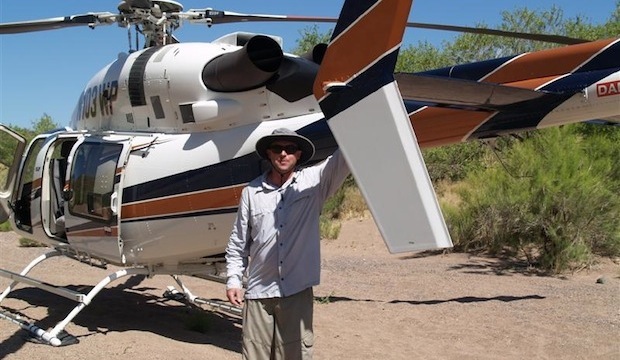
Travis Gibson shares insight into the life a USGS hydrologic technician for one of the USGS water science centers out west. Read more

The USGS plays an integral role in the new U.S. Water Partnership, which will bring together public and private resources to address water challenges around the world.

Timing is everything! Consider helping track changes in spring’s arrival
Meet one of the next generation of USGS physical scientists.

Flood Safety Awareness Week is March. 12-16. What can you do to prepare?

National Groundwater Awareness Week is Mar. 11-17, 2012. See how USGS science is connecting groundwater and surface water.

Since Japan’s March 11, 2011, Tohoku earthquake and subsequent tsunami, scientists at the USGS have learned much to help better prepare for a large earthquake in the United States.

Five USGS employees honored with Distinguished Service Awards for their service to the nation

Meet a member of the next generation of USGS hydrologic technicians.
Meet a member of the next generation of USGS hydrologic technicians.

It’s National Invasive Species Awareness Week. Did you know invasive species cost our country more than 100 billion dollars each year? Get to know America’s ten top invaders this week.
Groundwater in aquifers on the East Coast and in the Central U.S. has the highest risk of contamination from radium, a naturally occurring radioactive element and known carcinogen.

The proposed USGS budget reflects research priorities to respond to nationally relevant issues, including water quantity and quality, ecosystem restoration, hydraulic fracturing, natural disasters such as floods and earthquakes, and support for the National Ocean Policy, and has a large R&D component.

Four new reports examine the contaminants polycyclic aromatic hydrocarbons (PAHs) found in house dust, streams, lakes, soil, and air.

Exploding lakes in Cameroon, Africa, have killed people and livestock. Find out how USGS science is helping prevent such an event from occurring again.
A summer intern turned permanent employee discusses his career path. Most memorable moment

Oct. 9-15, 2011, is Earth Science Week, themed "Our-Ever Changing Earth," and Oct. 12, 2011, is International Day for Natural Disaster Reduction. Answers to questions posed by a changing world

As the team of responders struggled to end the worst oil spill in our Nation’s history, USGS scientist Paul Hsieh provided the critical scientific information needed to make a crucial decision.

After years of planning, the Department of the Interior has begun removing two dams on the Elwha River in Washington. But how will the removal of these dams impact the river’s sediments, waters, and fish?

As a nation, we use more than 75 billion gallons of groundwater each day. September 13 is the National Groundwater Association’s “Protect Your Groundwater Day.” What we can do to ensure we continue to have enough of it?
USGS scientists are working to characterize the contaminants and habitats for a number of aquatic species along the lower Columbia River.
The effects of drought are felt throughout the United States and the world, and USGS science has a prominent role in understanding the causes and consequences of this hydrological phenomenon.
USGS crews continue to measure streamflow and collect water quality and sediment samples in the Ohio and Mississippi River basins using state-of-art instruments.
Many communities in South Dakota, North Dakota, Montana, Colorado, Wyoming and Iowa are dealing with record floodwaters and bracing for more flooding in the upcoming weeks.

The most recent earthquake in Japan affected water levels in groundwater wells all over the country. Water level fluctuations were recorded as far away as Illinois, Virginia, Missouri and Florida.

Groundwater is one of our most vital natural resources. The USGS studies the quantity and quality of the nation's groundwater. Learn about USGS research in an aquifer near you.
Learn how 3-D modeling is used to examine groundwater and how this cutting edge science is used to solve tomorrow's problems today.
The Great Lakes are the largest freshwater system on Earth. However the basin has the potential for local shortages, according to a new basin-wide water availability assessment by the USGS.
The Department of the Interior has established a new website to find and share websites that provide water conservation and sustainability information.
The USGS is providing information on arsenic levels at the town level in Maine to protect human health and further promote citizen participation in State well-testing programs.
Water Security is the protection of adequate water supplies for food, fiber, industrial, and residential needs for expanding populations, which requires maximizing water-use efficiency, developing new supplies, and protecting water reserves in event of scarcity due to natural, manmade, or technological hazards.
Decreases in stream flow, which are often caused by human activities, affect the integrity of aquatic life in streams, according to a new USGS study.
The USGS and the National Weather Service have developed a new flood inundation map tool that enables management officials and residents to see where the potential threat of flooding is the highest along the Flint River near Albany, Georgia.
Looking for information on natural resources, natural hazards, geospatial data, and more? The USGS Education site provides great resources, including lessons, data, maps, and more, to support teaching, learning, K-12 education, and university-level inquiry and research.
The Chesapeake Bay has long been an R&R destination for DC residents. However, the watershed’s overpopulation contributes to its decline. Join us when USGS’s Scott Phillips and Peter Claggett discuss new science efforts applied to restoring the Nation's largest estuary on October 6th.
The "Flood and high flow" map shows the location of streamgages where the water level is currently above or near flood stage. Find out what rivers and creeks near you are doing.
Nutrient sources in both agricultural and urban areas contribute to elevated nutrient concentrations in streams and groundwater across the Nation.
USGS is playing a critical role in the federal government's coordinated Deepwater Horizon response efforts.
Population growth in the Kabul Basin, Afghanistan, due in part to returning refugees, is estimated to lead to a six-fold increase in drinking water needs by 2057. The USGS has worked in partnership with the Afghanistan Geological Survey to address questions of future water availability.
Flash flooding is one of the major causes of natural hazard-related deaths in the United States and is hard to predict, but data collected by the USGS is crucial to formulating better predictive models.
Did you know that contaminant-ridden dust from Africa may be harming coral reefs in the Caribbean? Scientists at the USGS are examining the air in Africa and in the Caribbean to determine what kinds of nutrients, microbes, and contaminants are traveling across the ocean.
Pharmaceutical manufacturing facilities can be a significant source of pharmaceuticals in surface water. The USGS is working with water utilities to try to reduce the release of pharmaceuticals and other emerging contaminants to the environment.
The United States Group on Earth Observations (USGEO) is working to connect Earth observations with public health, agriculture, climate, and data management and dissemination.
The USGS Science Strategy is a comprehensive report to critically examine the USGS's major science goals and priorities for the coming decade. The USGS is moving forward with these strategic science directions in response to the challenges that our Nation's future faces and for the stewards of our Federal lands.

In response to Hurricane Isaac, USGS has deployed several hundred storm surge sensors to collect information about the effects of Isaac on the Gulf Coast.

7 p.m.—Public lecture (also live-streamed over the Internet)

Join us on August 1 to learn more about the anatomy of flooding: What are the different causes of these extreme events, and how is USGS science helping prepare residents for future foods.

Join us in Menlo Park for our Evening Lecture on Scanning the Seafloor with Sound!

Stressed agricultural lands may be releasing less of the moisture needed to protect the breadbasket of a continent.

The U.S. Geological Survey had a very busy 2011 — below are a few of our highlights from last year.

Over the next 10 years, the USGS plans to conduct a new assessment of water availability and use. This national Water Census will address critical aspects of recent Federal legislation, including the need to establish a national water assessment program.

Recent USGS research shows that climate, vegetation, groundwater recharge rate, and proximity of the contaminants to the water table can all affect and control natural removal rates.
USGS scientists will join thousands of scientists, managers, and decision makers in Boston this week to present new findings on toxics at the Society for Environmental Toxicology and Chemistry (SETAC) conference in the Hynes Convention Center, Nov. 13-17.

On Nov. 3, USGS scientists Patrick Barnard and William Ellsworth will present a public lecture in Menlo Park, CA, providing Bay Area residents information about USGS research in the San Francisco Bay Area, including recent discoveries beneath San Francisco Bay and ongoing studies to better understand earthquake probabilities and the potential hazards associated with strong ground shaking.

Rivers and streams in the United States are releasing substantially more carbon dioxide into the atmosphere than previously thought.

Meet the R/V Muskie and the R/V Kaho, the USGS Great Lakes Science Center's two newest additions to its Great Lakes research fleet!

![]() U.S. Department of the Interior |
U.S. Geological Survey
U.S. Department of the Interior |
U.S. Geological Survey
URL: www.usgs.gov/blogs/features/usgs_top_story/despite-isaac-drought-persists-in-midlands/
Page Contact Information: Ask USGS
Page Last Modified: September 14, 2011


