
History
You are here: Census.gov › History › Reference › Maps › Distribution of Slaves in 1860
Maps
Distribution of Slaves in 1860
View Larger [5.5MB PDF]
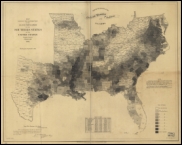
Distribution of the slave population in the South,
based on 1860 census results. Originally published in 1861.
Courtesy of the Library of Congress.
In 1861, in an attempt to raise money for sick and wounded soldiers, the Census Office produced and sold a map that showed the population distribution of slaves in the southern United States. Based on data from the 1860 census, this map was the Census Office's first attempt to map population density. It is a precursor to population density maps that have been produced since the 1870 census and especially forshadowed the work published in the Statistical Atlas of the United States by Francis Walker in 1874.
For more information:
- Mapping Slavery in the Nineteenth Century," [PDF 121KB] courtesy of the National Oceanic and Atmospheric Administration's Office of Coast Survey.
[PDF] or  denotes a file in Adobe’s Portable Document Format. To view the file, you will need the Adobe® Reader®
  available free from Adobe.
This symbol indicates a link to a non-government web site. Our linking to these sites does not constitute an endorsement of any products, services or the information found on them. Once you link to another site you are subject to the policies of the new site.
available free from Adobe.
This symbol indicates a link to a non-government web site. Our linking to these sites does not constitute an endorsement of any products, services or the information found on them. Once you link to another site you are subject to the policies of the new site.
 Facebook
 Twitter
 Flickr
 YouTube