Tue, 11 Sep 2012 05:15:00 EDT
High levels of low level moisture in place across the southwestern U.S. Will combine with two upper level disturbances to produce showers and thunderstorms with locally heavy rainfall and an increased potential for flash flooding today. Scattered showers and thunderstorms will increase with daytime heating across much of the western U.S. today, to the south of a cold front extending from Nevada into Wyoming. The cold front is moving through the north central U.S. with much cooler temperatures in its wake. Very low relative humidity and gusty winds will continue favorable conditions for wildfire development through at least Wednesday from the Northern Rockies into portions of the Northern and Central Plains. Much of the eastern half of the nation will experience pleasant conditions through the middle of the week thanks to an expansive dome of high pressure centered over the northern Mid-Atlantic region.
Latest local weather forecasts, warnings, watches, and advisories...
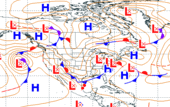
Hydrometeorological Prediction Center Short Range Forecast Discussion


Wed, 12 Sep 2012 06:51:52 EDT
There is a critical fire weather area today stretching from extreme northeastern Montana, through northern North Dakota, to far northwestern Minnesota.
Details...

 Tropical Storm Nadine
Wed, 12 Sep 2012 11:00:54 EDT
At 1100 AM AST the center of Tropical Storm Nadine was located about 940 miles east-northeast of the Lesser Antilles. Movement was toward the west-northwest near 15 MPH. A turn toward the northwest at a similar forward speed is expected later today followed by a turn toward the north-northwest Thursday night. Maximum sustained winds were near 60 MPH with higher gusts. Additional strengthening is forecast during the next 48 hours and Nadine is expected to become a hurricane tonight or on Thursday.
Details...
 New Tropical Depression forms in the eastern Pacific south of Manzanillo Mexico
Wed, 12 Sep 2012 11:00:15 EDT
At 800 AM PDT the center of newly formed Tropical Depression ELEVEN-E was located about 195 miles southwest of Manzanillo Mexico. Movement was toward the west-northwest near 10 MPH and this motion should continue during the next 48 hours. On this track the depression should be gradually moving away from the southwest coast of Mexico. Maximum sustained winds were near 35 MPH with higher gusts. The depression could become a tropical storm tonight or Thursday.
Details...


Wed, 12 Sep 2012 10:55:33 EDT
The United States Department of Agriculture Drought Portal provides resources and information related to the current drought crisis from across the Government. Throughout much of the country, communities are struggling with one of the worst droughts to strike the U.S. in decades. The lack of rain and high temperatures have done considerable damage to crops -- particularly those in the Midwest. USDA and other federal agencies are taking steps to help farmers, ranchers, and small businesses wrestling with this crisis.
Details...
Thu, 23 Aug 2012 10:56:00 EDT
This U.S. Drought Monitor week saw a few notable improvements and some serious degradation. Temperatures have generally been below normal this week from the east side of the Rockies to the East Coast, with the exception of Texas, the Southeast Coast, and northern New England. This has helped ease drought impacts, particularly in those areas where beneficial precipitation fell. One such area is in the Ohio Valley where parts of Indiana saw more than five inches of rain. This is the second straight week of beneficial precipitation for some of these areas and this precipitation has largely alleviated Exceptional Drought from the state, despite lingering impacts still being felt. Last week, drought gripped slightly less of the agricultural land in the country with 85% of the U.S. corn crop, 83% of soybeans, 63% of hay, and 71% of cattle areas experiencing drought.
Details...
 News from NOAA
Contiguous United States experiences third hottest summer on recordMon, 10 Sep 2012 10:36:45 -0400
NOAA scientists also report that the average temperature for the contiguous U.S. during August was 74.4°F, 1.6°F above the long-term average, marking the 16
th warmest August on record. The monthly analysis is produced by NOAA's National Climatic Data Center. See the
summary and the
full report.
Details...