Changes in Household Net Worth from 2005 to 2010

Bookmark and Share

Written by: Alfred Gottschalck and Marina Vornovytskyy

Household net worth or wealth is an important defining factor of economic well-being in the United States.  In times of economic hardship, such as unemployment, illness, or divorce, a person’s or household’s financial assets (e.g., savings accounts) are an additional source of income to help pay expenses and bills.  For individuals and households with a householder 65 years and older, wealth is also an important source of post-retirement income.

For all households, median household net worth decreased by 35 percent from 2005 ($102,844 [+/- 2,606]) to 2010 ($66,740[+/- 1,955]) (All comparisons are significant at the 90 percent level.  All dollar figures are in 2010 constant dollars). This decrease in median household net worth reflects the declines in housing values and stock market indices. However, excluding home equity, median household net worth increased by 8 percent from 2009 ($13,859) to 2010 ($15,000).

Compared with those who are older, the young have limited income or savings to acquire various assets, accumulate wealth, and diversify their wealth holdings. Between 2005 and 2010, median net worth decreased for all age groups but more for older householders than for younger ones.  For householders 65 and older, median net worth was equal to $195,890 in 2005 and $170,128 in 2010; for householders under 35, median net worth was equal to $8,528 in 2005 and $5,402 in 2010. When looked at in percentage terms, the story is quite different (see Figure 1).  Median net worth decreased by 37 percent for householders under age 35 compared with a 13 percent decrease for householders 65 and over. Thus, even though the 65 and over population lost more net worth in absolute terms, the younger age groups were disproportionately affected in terms of the share of net worth lost. The group with the largest decrease in percentage terms was the 35- to 44-year-old group, whose net worth decreased by 59 percent.
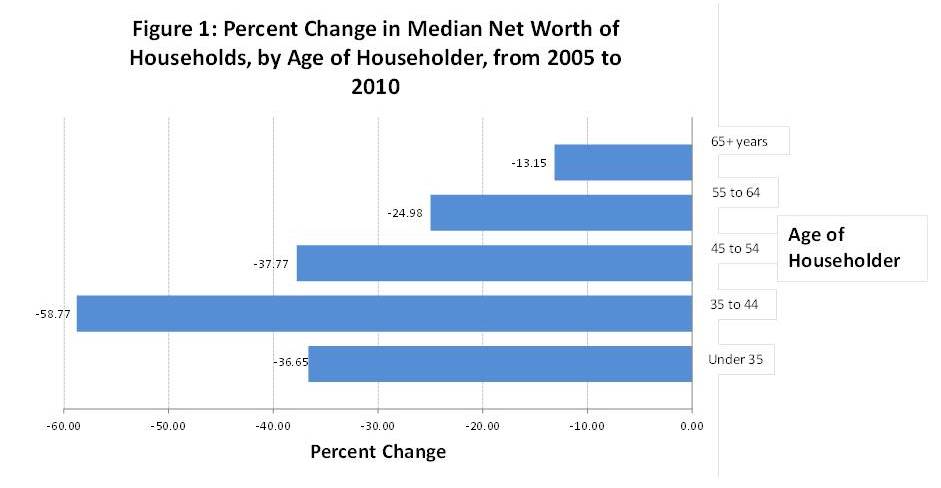
Figure 1: Percent Change in Median Net Worth of Households, by Age of Householder, from 2005 to 2010

Source: U.S. Census Bureau, Survey of Income and Program Participation 2004 and 2008 Panels
http://www.census.gov/sipp/sourceac/S&A04_W1toW12(S&A-9).pdf
http://www.census.gov/sipp/sourceac/S&A08_W1toW6(S&A-13).pdf

From 2005 to 2010, all educational attainment groups experienced decreases in their median net worth. For example, those with a high school diploma saw their median net worth decrease by 39 percent, and those with a bachelor’s degree saw their median net worth decrease by 32 percent. At the same time, higher levels of educational attainment continued to be associated with higher levels of net worth. In 2010, those with a graduate or professional degree had a median net worth of $245,763, while the median net worth of those with a high-school diploma was $42,223. Over the past decade, those with higher levels of educational attainment also fared better than those with lower levels of educational attainment (see Figure 2).  In 2000, those with a bachelor’s degree had a median net worth value almost twice as large as those with a high-school diploma; by 2010, this number had risen to almost three and half times as large. The same pattern can be seen when examining the graduate or professional degree to high school diploma ratio; this ratio has increased from 3.5 to 5.8 over the period of 2000-2010.

Figure 2: Ratio of Median Net Worth, by Educational Attainment of the Householder, 1998 to 2010

Source: U.S. Census Bureau, Survey of Income and Program Participation 2004 and 2008 Panels
http://www.census.gov/sipp/sourceac/S&A04_W1toW12(S&A-9).pdf
http://www.census.gov/sipp/sourceac/S&A08_W1toW6(S&A-13).pdf

For additional wealth statistics by select demographic and economic characteristics, please see http://www.census.gov/hhes/www/wealth/wealth.html.

Constant Dollars definition

Posted in Income | Leave a comment

What Did New Housing Look Like in 2011?

Bookmark and Share

Written by: Salima Jenkins

Every year, we collect data on the characteristics of new residential construction, such as square footage and the number of bedrooms, as well as average and median sales prices (for single-family houses only). These statistics are from the Survey of Construction, which is partially funded by the U.S. Department of Housing and Urban Development.

Here are a few interesting facts from the 2011 Characteristics of New Housing tables:

  • There were 306,000 new single-family homes sold in 2011. Of these, 19 percent had a garage that could hold 3 or more cars.
  • The size of the average single‑family house completed in 2011 was 2,480 square feet.
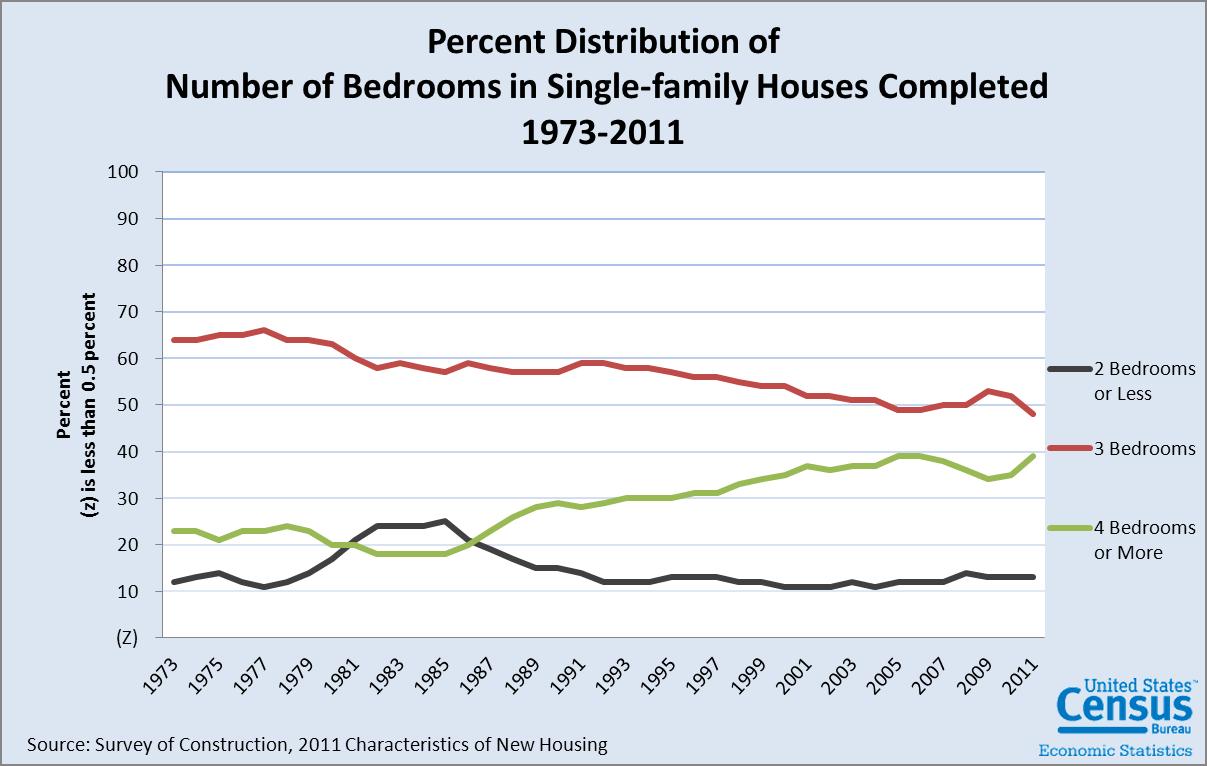
  • 39 percent of single‑family homes completed in 2011 had four or more bedrooms.  48 percent of them had three bedrooms.
  • Percent Distribution of Number of Stories in Single-family houses completedThe average sales price of new single‑family homes sold in the United States was $267,900. Average prices by region of the country were: Northeast $389,900; Midwest $241,700; South $248,900; and West $301,800.
  • 54 percent of single-family homes completed in 2011 had 2 or more stories.

Percent distirbution of number of bedrooms in single-family houses completed

  • 62 percent of multifamily units completed in 2011 used electricity for heating fuel, while 37 percent used gas.
  • The average square footage of multifamily units completed in 2011 and built for sale was 1,408, compared with 1,131 for those built for rent.

For more annual new housing characteristics data, for 2011 and prior years, please visit the Characteristics of New Housing website, where you can see a complete list of characteristics highlights and view the entire set of over 200 tables.

Additional information on housing characteristics is available from the American Community Survey and American Housing Survey.

Posted in Uncategorized | Leave a comment

Updated Version of TIGERweb Now Available

Bookmark and Share

Written by: Ricardo J. Ruiz

Have you been looking for a way to view all of the Census Bureau’s geographic areas and geographic information?  Do you need spatial data for your applications?

We just released an updated version of TIGERweb — a system to share Census Bureau geographic information online and a useful tool for measuring America’s places.

TIGERweb consists of a viewer application and various web services designed to meet the needs of a variety of data users, from those who just want to view census geography and features, like roads and rivers, to those who want to analyze spatial data and build applications. TIGERweb allows us to share through the Internet our Topologically Integrated Geographic Encoding and Referencing System (TIGER) database with the public.

What is TIGER?

TIGER contains over 30 legal and statistical geographic areas as well as transportation and hydrographic features covering the 50 U.S. states, the District of Columbia, and Puerto Rico. The beauty of this system is that users may view and analyze TIGER data with a geographic information system without having to download the data.

How does the TIGERweb viewer work?

The TIGERweb viewer allows users to view and query census geographic areas and features such as roads, railroads, and rivers. It has a variety of uses, such as reviewing legal and statistical area boundaries.  Among a number of attributes available, TIGERweb includes 2010 Census housing and population counts.

You can access the TIGERweb viewer here. In addition, the TIGERweb introductory web page contains general information including 508-compliant data files.

The TIGERweb viewer is not recommended for analyzing data or linking to data. For these tasks, TIGERweb offers two types of web services: the Open Geospatial Consortium, Inc. (OGC) Web Map Service (WMS) standard and Esri’s Representational State Transfer (REST) interface. Both options allow you to access the TIGER data stored in the TIGERweb database.

Users who have a client that supports the WMS standard may access the TIGERweb service by adding the following URL to their WMS client application:
//tigerweb.geo.census.gov/ArcGIS/services/tigerWMS/MapServer/WMSServer.

Users who have a client that supports the REST interface may access the TIGERweb service by adding the following URL to their REST client application: //tigerweb.geo.census.gov/ArcGIS/rest/services.

Currently, only 2010 Census boundaries are available in TIGERweb. However, we plan to include current and ACS boundaries by refreshing TIGERweb with new data twice every year.

For more information, see the tip sheet.

Posted in Geography | Leave a comment

2010 Census Shows Native Hawaiians and Other Pacific Islanders Surpassed One Million

Bookmark and Share

Written by: Lindsay Hixson and Nicholas A. Jones

According to the 2010 Census, 1.2 million people, or 0.4 percent of all people in the United States, identified as Native Hawaiian and Other Pacific Islander (NHPI), either alone or in combination with one or more races. This population grew by 40 percent from 2000 to 2010. People who reported being Native Hawaiian and Other Pacific Islander alone totaled 540,000, an increase of 35 percent from 2000 to 2010. The multiple-race Native Hawaiian and Other Pacific Islander population, as well as both the NHPI alone and NHPI alone-or-in-combination populations, all grew at a faster rate than the total U.S. population, which increased by 9.7 percent from 2000 to 2010.

Largest Detailed NHPI Groups: 2000 and 2010Geographically, the Native Hawaiian and Other Pacific Islander population experienced growth in every state in the country.  In fact, 32 states and the District of Columbia experienced an increase of more than 50 percent in their NHPI populations.

The figure shown presents the 6 largest detailed NHPI alone or in any combination groups in 2000 and 2010. The “in-any-combination” population represents the maximum number of people who identified with a particular detailed NHPI group (including people who reported that NHPI group and/or another NHPI group or race).

Native Hawaiian was the largest detailed Native Hawaiian and Other Pacific Islander group, numbering more than half a million.

In the 2010 Census, Native Hawaiian was the largest detailed NHPI group in the United States, numbering more than one-half million in 2010, up from just over 400,000 in 2000. There were 156,146 people who reported Native Hawaiian with no additional detailed NHPI group or race group, and an additional 370,931 people who reported Native Hawaiian in combination with one or more other races and/or detailed NHPI groups.  Thus, 527,077 people reported Native Hawaiian alone or in any combination.

The Samoan population and the Guamanian or Chamorro population were the second and third largest detailed NHPI groups in the United States

In 2010, there were 109,637 people who reported only Samoan and an additional 74,803 who reported Samoan in combination with one or more other races and/or detailed NHPI groups. This sums to 184,440 people who reported Samoan alone or in any combination.

There were 88,310 people who reported Guamanian or Chamorro alone and an additional 59,488 who reported Guamanian or Chamorro in combination with one or more other races and/or detailed NHPI groups. Thus, 147,798 people reported Guamanian or Chamorro alone or in any combination.

Although Native Hawaiians, Samoans, and Guamanians or Chamorros were the largest detailed NHPI alone or in any combination groups, they grew at slower rates than Tongans, Fijians, and Marshallese and much slower than many of the smaller detailed NHPI groups. The Tongan population grew by over one-half in size (from 36,840 in 2000 to 57,183 in 2010). Fijian more than doubled in size over the decade, increasing from 13,581 to 32,304. Marshallese more than tripled in size, increasing from 6,650 to 22,434.

The report provides statistics for additional detailed NHPI groups, such as Tahitians, Palauans, and Papua New Guineans. For more information on the NHPI population, see the 2010 Census Brief, The Native Hawaiian and Other Pacific Islander Population: 2010.

Posted in Population | Leave a comment

Mapping at the U.S. Census Bureau

Bookmark and Share

Written by: Lisa Sikes and Katy Rossiter

When you think of the Census Bureau, you might imagine filling out a census or survey form.  Maybe you think of the billions of statistics and counts that are available. What you may not realize is that the Census Bureau is as much a geographic and cartographic agency as it is a statistical agency.  We produce millions of maps to support our many censuses and surveys.  Here are three ways these maps are vital to collecting the information we use to measure our people, places and economy and understanding the statistics we produce.

1. Maps assist census workers in the field gathering data.

These maps contain all of the information a field worker needs to get to each house in their survey or census operation.  They usually contain streets, rivers, a spot on the map representing each address, and census boundaries, such as census blocks.

As the country’s population has grown and technology has advanced, so has the need for maps for our field workers. Here is a look at how maps were created for each nationwide census and the amount made:

  • 1970 – Cartographers painstakingly produced 25,800 maps using pen and ink and a wax backed lettering method
  • 1980 – Technology of scribing and overlay allowed 33,000 maps to be created
  • 1990 – Quantum shift in technology to electrostatic printers and the development of TIGER, our geographic database, had taken place. We produced over 1.3 million maps
  • 2010 – Over 17 million maps were produced in PDF for use in field operations (at the peak of production we created a map every 1.2 seconds!).  Maps were plotted in over 470 different locations on printers running around the clock for use by field workers.

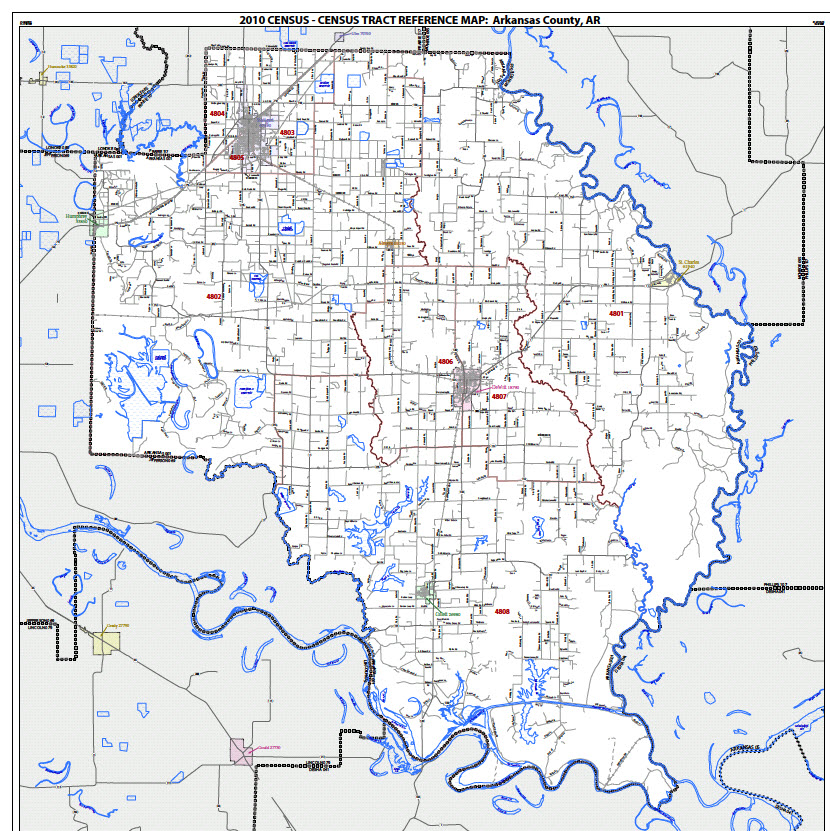
2. RefeTractReferencerence maps display our geographic boundaries. 

We create these maps so you can see what our geographic boundaries look like or see the census geography where you are located.  Real estate agents use these types of maps to see what census tract contains a particular house or business.  Economic developers use these types of maps to see if their property is in an urban area.  Your congressional representative uses these types of maps to see the area they represent.

BlockReference

3. Thematic and special purpose maps present census statistics in eye-catching and meaningful ways. 

Maps are a great way to present information visually because they can easily show information about our population. A table shThematic Mapows a list of numbers, such as the population density, but a thematic map visualizes the data, revealing spatial patterns, such as a concentration of people.

The Census Bureau produces maps to illustrate information following the release of decennial census counts and census survey statistics.  We have also produced maps for major events, such as the Mississippi River flood in May 2011.

To view some of our maps, visit http://www.census.gov/geo/www/maps/CP_MapProducts.htm.

Posted in Uncategorized | 2 Comments