 An Official Website of the United States Government
Tuesday, May 31, 2011

An Official Website of the United States Government
Tuesday, May 31, 2011
On June 1, 2009 the Obama Administration launched the IT Dashboard. Through the IT Dashboard, Federal agencies and the public have the ability to view details of Federal information technology (IT) investments online and to track their progress over time. The IT Dashboard displays data received from agency Exhibit 53 and Exhibit 300 reports, including general information on over 7,000 Federal IT investments and detailed data for over 800 of those investments that agencies classify as "major." Agency Chief Information Officers (CIO) are responsible for evaluating and updating select data on a regular basis, which is accomplished through interfaces provided by the IT Dashboard.
The IT Dashboard displays a subset of data from agency Exhibit 53 and Exhibit 300 reports, and agency updated milestone information, agency CIO evaluations, and other investment information reported by agencies. For a comprehensive list of data elements available to the public on the IT Dashboard, see "Publicly Available Data Fields"
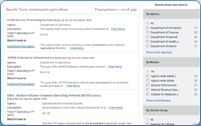
The following 27 agencies have data available on the IT Dashboard:
Only agency-authorized users have access privileges to the IT Dashboard "My Investments" screen, where data updates are made. This screen is not visible to those without access, or to the general public.
The " pre-decisional period " refers to the period between November and February when agencies submit data for the following Budget Year, as part of the annual federal budget process. Exhibit 53 and Exhibit 300 data that agencies submit for the Budget Year cycle is considered "pre-decisional" and is not publicly posted on the IT Dashboard until after release of the President's Budget in February.
The final Exhibit 53s and Exhibit 300s for the Budget Year should be based on Presidential Budget decisions. At this point, future spending, defined as beyond the Budget Year requested and as provided in the Summary of Spending table in Section B of the Exhibit 300, will not be displayed on the IT Dashboard public view. All variances and planned values for in-progress milestones are considered pre-decisional and will not be publicly displayed on the IT Dashboard. Future milestones are also considered pre-decisional and will not have any fields publicly displayed on the IT Dashboard until after the release of the President's Budget. Each agency can access only its own pre-decisional data and not other agencies' secured information.
No. The IT Dashboard does not include security or privacy related information on investments. Furthermore, procurement related information is provided for active awarded contracts only (as reported in Section C of Exhibit 300) and out-year milestone costs are not displayed. USAspending.gov is the IT Dashboard's source for much of the procurement data. USAspending.gov pulls data from the publicly-accessible Federal Procurement Data System (FPDS) on a daily basis. To prevent the exposure of potentially sensitive data, agencies should always review submissions for possible sensitive data in inappropriate data fields and proper identification of data in published fields as sensitive (e.g., avoid identifying contracts not yet awarded as "awarded" or aspects of the agency acquisition strategy.)
The IT Dashboard displays no procurement-sensitive information from the Exhibit 300s. Additional acquisition data associated with contracts identified in the Exhibit 300 (e.g., contractor name) are linked to publicly available records on the USA Spending website.
The IT Dashboard does not display any security-related information. Any decisions related to the publication of security data, in the future, will be made in coordination with submitting agencies and reflected in future OMB guidance.
The IT Dashboard only displays information that has been authorized to be released via application and database controls. As always, it is incumbent upon the agencies to review their submissions for the inadvertent inclusion of private data in an inappropriate field.
The IT Dashboard does not provide the name of the Program/Project Manager of an investment.
No. Planned cost data for future milestones are obscured in the IT Dashboard public views.
All performance metrics are displayed on the IT Dashboard for all years reported in the Exhibit 300, except during the "Pre-Decisional Period."
For the IT Dashboard, cost and schedule data, contracts data, performance metrics, Reports and Evaluations by Agency CIOs (Evaluations) are submitted and updated using XML API (System-to-System Integration or Manual XML Load). Only users with valid MAX credentials are able to submit data. Details of the XML API can be found on the MAX Portal at https://max.omb.gov/community/display/Egov/A-11+Schemas.
Cost and schedule reporting are only required for major investments, on a monthly basis. At this time, there are no plans to enable monthly updates to non-major investments.
Agency CIOs' biographical information, photos, and contact information available on the IT Dashboard are supplied via data feeds from www.CIO.gov. Agencies should make any necessary updates to the Agency CIO information via the CIO.gov website.
Evaluations are one of three component ratings driving the overall investment rating. The other two component ratings are "Cost" and "Schedule." The Agency CIO rates each investment based on his or her best judgment, using a set of pre-established criteria (see Question 16). As a rule, the Evaluation should reflect the CIO's assessment of the risk and the investment's ability to accomplish its goals. While cost and schedule reflect past and current performance, the Evaluation should consider these as only two of several key indicators of future investment success. CIOs should consult with appropriate stakeholders in making their evaluation, such as Chief Acquisition Officers, program managers, etc.
The following factors and supporting examples should be used to inform the Evaluation:
| Evaluation Factor | Supporting Examples |
|---|---|
| Risk Management |
|
| Requirements Management |
|
| Contractor Oversight |
|
| Historical Performance |
|
| Human Capital |
|
| Other |
|
The Evaluation can and should be updated at any time throughout the life of the investment. CIOs should update the rating as soon as new information becomes available that affects the assessment of a given investment. Evaluation ratings are based on a five-point risk scale, as follows:
| Evaluation (By Agency CIO) |
Points | Color |
|---|---|---|
| 5-Low Risk | 10 | Green |
| 4-Moderately Low Risk | 7.5 | Green |
| 3-Medium Risk | 5 | Yellow |
| 2-Moderately High Risk | 2.5 | Red |
| 1-High-Risk | 0 | Red |
An IT investment can be made up of one or more IT projects. Each IT investment should be a discrete line item in the Agency's Exhibit 53. Projects are generally reflected as individual items in the first level (Level 1) of an investment's work breakdown structure (WBS). IT contracts themselves are not necessarily synonymous with IT investments but, rather, they are generally used to support IT investments and IT projects.
For each investment, agencies should provide the activities used to measure cost and schedule performance, representing only one level of the investment's work breakdown structure. This should generally correspond to Level 3 of the Work Breakdown Structure. (See OMB Circular A-11, Section 300 and the Exhibit 300 for more information).
Cost Rating (Used only for the Overall Rating calculation)
Continuous, composed of line segments, connecting the following values:
| % Cost Variance | Cost Rating (0-10 scale) |
|---|---|
| 0% | 10 |
| 10% | 7 |
| 30% | 3 |
| >50% | 0 |
Cost Color Coding
| Cost Rating | Color |
|---|---|
| 10 , > 7 | Green |
| = 7 , > 3 | Yellow |
| = 3 , = 0 | Red |
Milestone Color Coding (for Cost Summary milestones chart)
| % Cost Variance | Color |
|---|---|
| 0% , < 10% | Green |
| = 10% , < 30% | Yellow |
| = 30% | Red |
Schedule Rating (used only for the Overall Rating calculation)
Continuous, composed of line segments connecting following values:
| % Schedule Variance | Schedule Rating (0-10) |
|---|---|
| 0% | 10 |
| 10% | 7 |
| 30% | 3 |
| >50% | 0 |
Schedule Color Coding
| Schedule Rating | Color |
|---|---|
| 10 , > 7 | Green |
| = 7 , > 3 | Yellow |
| = 3 , = 0 | Red |
Milestone Colors (for Schedule Variance in Days milestones chart)
| % Schedule Variance | Color |
|---|---|
| 0% , < 10% | Green |
| = 10% , < 30% | Yellow |
| = 30% | Red |
The Evaluation, Cost, and Schedule ratings each represent one-third of the “Overall Rating” for the investment. When the CIO's Evaluation is lower than or equal to both the Cost and Schedule ratings, the CIO Evaluation entirely overrides those individual Cost and Schedule ratings and represents 100% of the investment’s Overall Rating. When an investment has not yet been assessed by the Agency CIO, the average of Cost and Schedule ratings will determine the Overall Rating.
The IT Dashboard does not have an approval workflow function. Only baselines approved in accordance with OMB and Agency policy should be submitted to the IT Dashboard by authorized users.
The IT Dashboard does not distinguish between DME and SS (as reported in Exhibit 53) for Cost and Schedule ratings. The Planning, Acquisition, and Operations and Maintenance (O&M) milestones from an investment's Exhibit 300 are used for Cost and Schedule calculations.
No, Agencies are not required to report interagency agreements in the Exhibit 300 Contracts table. However, OMB expects agencies to report all interagency agreements as contributions in the Exhibit 53. Currently, there is no single authoritative source to validate these agreements.
The IT Dashboard links to www.USAspending.gov for contract information. Each contract submitted to the IT Dashboard that is not matched by the agency with FPDS (or USAspending.gov) is clearly indicated with a red "X" symbol ( ![]() ) as an invalid Contract Number. This symbol is displayed unless a contract with a matching combination of the following fields is submitted to the IT Dashboard:
) as an invalid Contract Number. This symbol is displayed unless a contract with a matching combination of the following fields is submitted to the IT Dashboard:
If this combination of fields for each contract record is not a one-for-one exact match with data in FPDS, the IT Dashboard displays the red “X” symbol with the following note: “Agency-provided contract information does not match with a www.USASpending.gov record.”
To assist in the linkage of contract and task order numbers from the Exhibit 300 Contracts Table to FPDS, agencies should provide the following information to the IT Dashboard for "Contract/Task Order Numbers," based on the FPDS-NG data requirements (as specified in the FPDS-NG Data Element Dictionary https://www.fpds.gov/downloads/Version_1.4.2_specs/FPDSNG_DataDictionary_V1.4.2.pdf).
| Part of Indefinite Delivery Vehicle (IDV)? | Procurement Instrument Identifier (PIID) | Example |
|---|---|---|
| No | Data Element 1A (NTE 50 characters) | "00063200203DNBCHC020042" |
| Yes | Data Element 1A, and the Referenced PIID, Data Element 1C (NTE 100 characters) | "GS09Q08DN0165-IDV-GS10F0216N" |
| Data Element | Source |
|---|---|
| Unique Project Identifier | Exhibit 300, Part I: Section A |
| Date of Submission | Exhibit 300, Part I: Section A |
| Investment Name | Exhibit 53 |
| Investment Description | Exhibit 53 |
| Agency CIO Name | www.CIO.gov |
| Agency CIO Email | www.CIO.gov |
| Agency CIO Photo | www.CIO.gov |
| Agency CIO Bio | www.CIO.gov |
| Awarded Contracts: Contract Number | Exhibit 300, Part I: Section C |
| Awarded Contracts: Award Date | www.USAspending.gov |
| Awarded Contracts: Action Obligation Amount | www.USAspending.gov |
| Awarded Contracts: Vendor Name | www.USAspending.gov |
| Awarded Contracts: Type of Contract | www.USAspending.gov |
| Awarded Contracts: Start Date of Contract | www.USAspending.gov |
| Awarded Contracts: End Date of Contract | www.USAspending.gov |
| Performance Information: Measurement Area | Exhibit 300, Part I: Section E |
| Performance Information: Measurement Grouping | Exhibit 300, Part I: Section E |
| Performance Information: Measurement Indicator | Exhibit 300, Part I: Section E |
| Performance Information: Baseline | Exhibit 300, Part I: Section E |
| Performance Information: Actual Results | Exhibit 300, Part I: Section E |
| Performance Information: Target | Exhibit 300, Part I: Section E |
| Performance Information: Rating | Exhibit 300, Part I: Section E |
| Cost/Schedule: Milestone Description | Exhibit 300, Part II: Section B |
| Cost/Schedule: Percent Complete | Exhibit 300, Part II: Section B |
| Cost/Schedule: Planned Completion Date | Exhibit 300, Part II: Section B |
| Cost/Schedule: Actual Completion Date | Exhibit 300, Part II: Section B |
| Cost/Schedule: Planned Start Date | Exhibit 300, Part II: Section B |
| Cost/Schedule: Actual Start Date | Exhibit 300, Part II: Section B |
| Cost/Schedule: Total Planned Cost | Exhibit 300, Part II: Section B |
| Cost/Schedule: Total Actual Cost | Exhibit 300, Part II: Section B |
| Cost/Schedule: Cost Variance | System Calculated |
| Cost/Schedule: Schedule Variance | System Calculated |
The majority of the Exhibit 53 data elements are populated by agencies during the yearly Exhibit 53 submissions. However, there are some exceptions where fields are calculated, system-derived, or system-generated. The list of Exhibit 53 data elements with descriptions, source, and XML schema fields is available at http://it.usaspending.gov/faq-agencies/exhibit-53-fields.
The majority of the Exhibit 300 data elements are populated by agencies during the full Exhibit 300 submissions and monthly investment updates. However, there are some exceptions where fields are calculated, system-derived, system-generated or originate from the Exhibit 53 submission. The list of Exhibit 300 data elements with descriptions, source, and XML schema fields is available at http://it.usaspending.gov/faq-agencies/exhibit-300-fields.
Download PDF Version 

Overview of IT Dashboard
Search and Filter Techniques