- Home
SUBJECT AREAS »
- Inflation & Prices
- Spending & Time Use
- Unemployment
- Employment
- Pay & Benefits
- Productivity
- Workplace Injuries
- International
- Demographics
- Industries
- Business Costs
- Occupations
- Geography
Resources For »
- Business Leaders
- Consumers
- Economists
- Investors
- Jobseekers
- Media
- Public Policymakers
- Students & Teachers
- Survey Respondents
At a Glance Tables »
- U.S. Economy
- Regions, States, & Areas
- Industries
- Subject Areas
-
Inflation & Prices »
- Consumer Price Index
- Producer Price Indexes
- Import/Export Price Indexes
- Employment Cost Index
- Contract Escalation
- Price Index Research
- Inflation & Prices Overview
-
Pay & Benefits »
- Employment Costs
- National Compensation Data
- Wages by Area & Occupation
- Earnings by Demographics
- Earnings by Industry
- County Wages
- Benefits
- Compensation Research
- Strikes & Lockouts
- Pay & Benefits Overview
-
Spending & Time Use »
- Consumer Expenditures
- How Americans Spend Time
-
Unemployment »
- National Unemployment Rate
- State & Local Unemployment Rates
- Mass Layoffs
- Unemployment Research
- Unemployment Overview
-
Employment »
- National Employment
- State & Local Employment
- State & County Employment
- Worker Characteristics
- Employment Projections
- Job Openings & Labor Turnover
- Employment by Occupation
- Work Experience Over Time
- Business Employment Dynamics
- Employment Research
- Employment Overview
-
Workplace Injuries »
-
Productivity »
- Labor Productivity & Costs
- Multifactor Productivity
- Productivity Research
- Productivity Overview
-
International »
- International Labor Comparisons
- International Technical Cooperation
- Import/Export Price Indexes
- International Overview
-
REGIONAL OFFICES »
- New England (Boston)
- New York-New Jersey (NY City)
- Mid-Atlantic (Philadelphia)
- Southeast (Atlanta)
- Midwest (Chicago)
- Southwest (Dallas)
- Mountain-Plains (Kansas City)
- West (San Francisco)
- Regional Overview
-
- Databases & Tools
- Publications
- Economic Releases
- Beta
|
The Occupational Employment Statistics (OES) program produces employment and wage estimates for over 800 occupations. These are estimates of the number of people employed in certain occupations, and estimates of the wages paid to them. Self-employed persons are not included in the estimates. These estimates are available for the nation as a whole, for individual States, and for metropolitan and nonmetropolitan areas; national occupational estimates for specific industries are also available.
On This PageOES Data HighlightsOccupational Employment Statistics (OES) Highlights:Using Occupational Employment Statistics (OES) Data in a Job SearchApril 2011 Searching for a job in a recovering economy can be a daunting task. Whether they are recent graduates or professionals contemplating switching careers, job seekers can ease this process by understanding the distinct resources available to them. More specifically, prospective employees can use Occupational Employment Statistics (OES) data to find the industries and geographic areas with the highest employment and wages for occupations that are of interest to them.
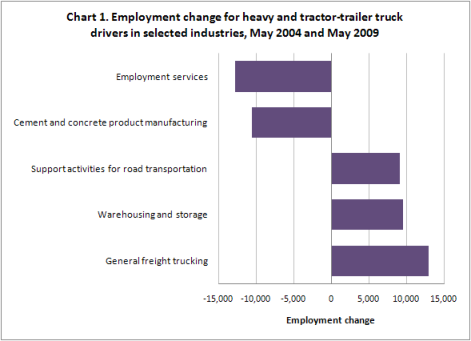
Chart 1 shows how employment for heavy and tractor-trailer truck drivers declined between 2004 and 2009 in specific industries, including employment services and cement and concrete product manufacturing. More...
Latest OES News ReleaseOccupational Employment and Wages by Ownership
July 27, 2010
Retail salespersons and cashiers were the two largest occupations
in the private sector in May 2009. Postal service mail carriers;
correctional officers and jailers; and elementary school
teachers, except special education, had the highest employment
among all occupations in federal, state, and local government,
respectively.
More... Occupational Employment and Wages
May 14, 2010
In 2009, occupations with employment larger than 700,000 accounted for 46
percent of total U.S. employment. Occupations with the highest employment
included retail salespersons, cashiers, and general office clerks.
Occupations with the lowest employment included watch repairers, astronomers,
and radio operators.
More... Current
Archived
OES DatabasesDatabases
More Tools
OES TablesFeatured Tables: May 2009 estimates
Current Tables: May 2009 estimates
Archived TablesDocumentation
OES Publications
OES Frequently Asked QuestionsFrequently Asked Questions
OES Special Notices
OES Related Links
Contact UsContactsFor additional information concerning the Occupational Employment Statistics (OES) Survey, contact an OES staff member at:
|