| | |||||||||
| | |||||||||
 | |||||||||
|
|
2004
Earth Feature Story Special: The Benefits of Hydrologic Predictability Each year, millions of gallons of water that flow through our rivers and tributaries offer a massive source of renewable energy—hydropower. It’s clean and efficient, currently supplying about 10 percent of the electricity in the United States and up to 70 percent of electricity demand in the Pacific Northwest. Unlike some other energy sources, hydropower does not produce greenhouse gases or air pollution. With so much at stake for U.S. citizens and those who manage water systems, improving long-lead forecasts of river streamflow can allow operators of large reservoirs to plan for expected inflows and produce hydropower more efficiently. Anticipated seasonal inflows are also of importance to large users of water, such as irrigators and farmers and hydropower reservoirs also contribute to local economies. A study of one medium-sized hydropower project in Wisconsin showed that the recreational value to residents and visitors exceeded $6.5 million annually.
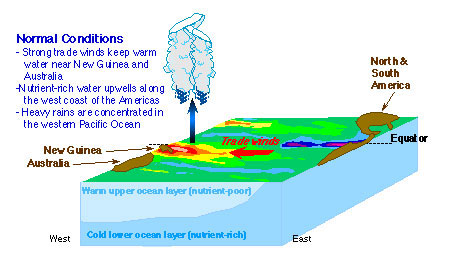
The most common type of hydroelectric power plant is an impoundment facility. This is typically a large system, and uses a dam to store river water in a reservoir. Water released from the reservoir flows through a turbine, spinning it, which in turn activates a generator to produce electricity. The water may be released either to meet changing electricity needs or to maintain a constant reservoir level. Advances in long-lead climate forecasting have made it possible to produce useful streamflow forecasts further in advance, but many are based on only one or two variables, such as snowpack estimates. Additionally, few studies have explored the economic value of hydrologic predictability. To examine the economic benefit of incorporating additional data into long-lead forecasts, scientists Edwin Maurer of Santa Clara University and Dennis Lettenmaier at the University of Washington, linked remote conditions, such as tropical sea surface temperatures, land surface moisture levels and regional climate to streamflow in the Missouri River basin. “Many studies have suggested that combining better land moisture data with forecasts of distinct, long-term weather patterns created by atmospheric phenomena like El Nino/Southern Oscillation (ENSO) would be of value to the water management community. We attempted to quantify this, gaining insight into the relative effects of each new source of information,” said Maurer. El
Nino / Southern Oscillation (ENSO) marks a see-saw shift in surface air pressure
between Darwin, Australia and the South Pacific Island of Tahiti. When the pressure
is high at Darwin it is low at Tahiti and vice versa. El NiÒo, and its
sister event La NiÒa, are the extreme phases of this southern oscillation,
with El Nino referring to a warming of the eastern tropical Pacific, and La Nina
a cooling. Lettenmaier said “the ENSO condition is one of the most valued
tools in any long-term forecast because it has major consequences on weather patterns
and is generally well understood.”
These sea surface temperature (SST) anomalies--departures from the mean state--change atmospheric wind patterns in the mid-latitudes in winter and spring, shifting the way moist air gets transported in the atmosphere, directly affecting U.S. precipitation, snow accumulation and soil moisture, which in turn impacts water runoff into river basins. The researchers used data from the NOAA/NASA North American Land Data Assimilation project (NLDAS) to produce model simulations that considered several atmospheric variables, including soil moisture. “Errors in long-lead forecasts are often traced back in part to inaccuracies in the observed initial conditions used to make the forecast, said Lettenmaier. NLDAS is working to refine this information.” Snow and soil moisture data are currently produced using images from NASA’s Moderate Resolution Imaging Spectroradiometer (MODIS) and the Advanced Microwave Scanning Radiometer (AMSR). NASA’s Hydrosphere State Mission (HYDROS), scheduled for launch in 2010, will provide the first global views of Earth's changing soil moisture and land surface freeze/thaw conditions, leading to breakthroughs in water, energy and carbon management.
The study’s findings, published in the January 2004 issue of Journal of Climate show that use of climate forecast information combined with better snow water content and soil moisture data can improve runoff predictions in ways that might yield some economic value. A typical goal of water management is to keep reservoirs as full as possible, while minimizing spill, to maintain maximum hydropower production. Hydropower's operational flexibility and its unique ability to change output allows water managers to respond effectively to forecast data. For example, if water system managers were warned of an upcoming dry season, they would likely retain higher than normal water levels, usually by reducing the amount of water typically evacuated from the system. Clearly, “improved and additional predictability, and thus a reduced uncertainty in flow volumes, translates into greater hydropower benefits,” said Maurer. Some river basins, including the Missouri, have such large storage capacities that variations in annual inflow have little impact on hydropower generation. In the study, hydropower benefits increased by only 1.8 percent, from $530 million to $540 million.
A seasonal analysis conducted by Maurer and Lettenmaier pointed to a general decrease in predictability with increasing lead time, high levels of predictability for winter runoff at short lead times, and the importance soil moisture and snow water content for improved runoff predictability. Furthermore, the economic payoffs for improved predictions were found to be most significant in the winter and spring, when climate and land surface conditions can provide information about the large inflows in the spring and summer.
While the study only considered hydropower impacts of added hydrologic predictability, since they are the dominant benefits for the Missouri River reservoirs, improved long-lead forecasts of anticipated river inflows can also impact downstream navigation, habitat protection and recreation. The reservoirs formed by hydroelectric dams also often provide many water-based recreational opportunities including fishing, water sports, and boating. Many hydro operators own a significant amount of land around many reservoirs that is open to the public for uses including hiking, hunting and skiing. These may be larger factors in other basins, and would bring new dimensions to the value of predictability and the importance of better defining the land surface moisture and SST conditions. For more information contact: Mike
Bettwy
|


 |  |  |  |
| Site Manager: Lynn Jenner |