Improve health, fitness, and quality of life through
daily physical activity.
The 1990s brought a historic new perspective to exercise,
fitness, and physical activity by shifting the focus from intensive vigorous
exercise to a broader range of health-enhancing physical activities. Research
has demonstrated that virtually all individuals will benefit from regular physical
activity.[1] A Surgeon General’s report on
physical activity and health concluded that moderate physical activity can
reduce substantially the risk of developing or dying from heart disease, diabetes,
colon cancer, and high blood pressure.1
Physical activity also may protect against lower back pain and some forms of
cancer (for example, breast cancer), but the evidence is not yet conclusive.[2], [3]
On average, physically active people outlive those who are
inactive.[4], [5],
[6],
[7],
[8]
Regular physical activity also helps to maintain the functional independence of
older adults and enhances the quality of life for people of all ages.[9], [10],
[11]
The role of physical activity in preventing coronary heart
disease (CHD) is of particular importance, given that CHD is the leading cause
of death and disability in the United States. Physically inactive people are
almost twice as likely to develop CHD as persons who engage in regular physical
activity. The risk posed by physical inactivity is almost as high as several
well-known CHD risk factors, such as cigarette smoking, high blood pressure,
and high blood cholesterol. Physical inactivity, though, is more prevalent than
any one of these other risk factors. People with other risk factors for CHD,
such as obesity and high blood pressure, may particularly benefit from physical
activity.
Regular physical activity is especially important for people
who have joint or bone problems and has been shown to improve muscle function,
cardiovascular function, and physical performance.[12]
However, people with arthritis (20 percent of the adult population) are less
active than those without arthritis.[13]
People with osteoporosis, a chronic condition affecting more than 25 million
people in the United States, may respond positively to regular physical
activity, particularly weight-bearing activities, such as walking,[14]
and especially when combined with appropriate drug therapy and calcium intake.
Increased bone mineral density has been positively associated with aerobic
fitness, body composition, and muscular strength.[15]
Although vigorous physical activity is recommended for
improved cardiorespiratory fitness, increasing evidence suggests that moderate
physical activity also can have significant health benefits, including a
decreased risk of CHD. For people who are inactive, even small increases in
physical activity are associated with measurable health benefits. In addition,
moderate physical activity is more readily adopted and maintained than vigorous
physical activity.[16]
As research continues to illustrate the links between physical activity and
selected health outcomes, people will be able to choose physical activity
patterns optimally suited to individual preferences, health risks, and
physiologic benefits.
For individuals who do not engage in any physical activity
during their leisure time, taking the first step toward developing a pattern of
regular physical activity is important. Unfortunately, few individuals engage
in regular physical activity despite its documented benefits. Only about 23
percent of adults in the United States report regular, vigorous physical
activity that involves large muscle groups in dynamic movement for 20 minutes
or longer 3 or more days per week. Only 15 percent of adults report physical
activity for 5 or more days per week for 30 minutes or longer, and another 40
percent do not participate in any regular physical activity.
Public education efforts need to address the specific
barriers that inhibit the adoption and maintenance of physical activity by
different population groups. Older adults, for example, need information about
safe walking routes. Persons with foot problems need to learn about proper foot
care and footwear in order to reach appropriate activity levels. People with
CHD and other chronic conditions must understand the importance of regular
physical activity to maintain physical function. Each person should recognize
that starting out slowly with an activity that is enjoyable and gradually
increasing the frequency and duration of the activity are central to the
adoption and maintenance of physical activity behavior. Along with the public
education efforts, public programs in a variety of settings (recreation
centers, worksites, health care settings, and schools) need to be developed,
evaluated, and shared as potential models. The availability of group activities
in the community is important for many.
Disparities in levels of physical activity exist among
population groups. The proportion of the population reporting no leisure-time
physical activity is higher among women than men, higher among African
Americans and Hispanics than whites, higher among older adults than younger
adults, and higher among the less affluent than the more affluent. Participation
in all types of physical activity declines strikingly as age or grade in school
increases. In general, persons with lower levels of education and income are
least active in their leisure time. Adults in North Central and Western States
tend to be more active than those in the Northeastern and Southern States.
People with disabilities and certain health conditions are less likely to engage
in moderate or vigorous physical activity than are people without disabilities.
Health promotion efforts need to identify barriers to physical activity faced
by particular population groups and develop interventions that address these
barriers.1
Data demonstrate that major decreases in vigorous physical activity occur
during grades 9 through 12. This decrease is more profound for girls than for
boys, whether the measure is engaging in vigorous physical activity in general
or in team sports. The President’s Council on Physical Fitness and Sports
concluded that because of the physical health and emotional benefits of
physical activity, it should have an increasingly important role in the lives
of girls.[17] Adolescents’ interest and
participation in physical activity differ by gender.17
Therefore, strategies to increase the amount of physical activity for boys and
girls must address these differences and must begin before the disparities in
levels of physical activity manifest themselves. Compared to boys, girls are
less likely to participate in team sports but more likely to participate in
aerobics or dance. Often girls and boys perceive different benefits from
physical activity, with boys viewing such activity as competition and girls as
weight management. These factors must be considered in developing programs to
address the needs of girls. Because boys are more likely than girls to have
higher self-esteem and greater physical strength, programs addressing the needs
of girls should provide instruction and experiences that increase their
confidence and their opportunities to participate in activities, as well as
social environments that support involvement in a range of physical activities.17
The Healthy People 2010 objectives offer opportunities to
ensure that physical activity and fitness become part of regular healthy
behavioral patterns. Encouraging any type or amount of physical activity in
leisure time can provide important health benefits, compared to a sedentary
lifestyle.
Activities that promote strength and flexibility are
important because they may protect against disability, enhance functional
independence, and encourage regular physical activity participation. These
benefits are particularly important for older people—a good quality of life
means being functionally independent and being able to perform the activities
of daily living.
Young people are at particular risk for becoming sedentary
as they grow older. Therefore, encouraging moderate and vigorous physical
activity among youth is important. Because children spend most of their time in
school, the type and amount of physical activity encouraged in schools are
important components of a fitness program and a healthy lifestyle.
The major barriers most people face when trying to increase
physical activity are time, access to convenient facilities, and safe
environments in which to be active. Counseling by primary care providers about
the need to participate in physical activity also is an important way to change
behavior. In addition, facilities need to be accessible to people with
disabilities.
Of the 13 physical activity and fitness objectives, 1 has
been met—increasing worksite fitness programs. Four objectives show solid
gains, indicating that the message about increased physical activity is
reaching some segments of the population. The message that a sedentary
lifestyle plays a role in both overweight and weight loss needs to be addressed
better, as does the role primary care providers can play in counseling
individuals to increase their daily activities. Both the quantity and quality
of school physical education have slipped. Data to evaluate access and
availability of community fitness facilities are not available.
Note: Unless otherwise
noted, data are from the Centers for Disease Control and Prevention, National Center for Health Statistics, Healthy People 2000
Review, 1998–99.
Physical Activity and Fitness
Goal: Improve health, fitness, and quality of life through
daily physical activity.
|
Number
|
Objective Short Title
|
|
Physical Activity in Adults
|
|
22-1
|
No leisure-time physical activity
|
|
22-2
|
Moderate physical activity
|
|
22-3
|
Vigorous physical activity
|
|
Muscular Strength/Endurance and
Flexibility
|
|
22-4
|
Muscular strength and endurance
|
|
22-5
|
Flexibility
|
|
Physical Activity in Children and
Adolescents
|
|
22-6
|
Moderate physical activity in
adolescents
|
|
22-7
|
Vigorous physical activity in
adolescents
|
|
22-8
|
Physical education requirement in
schools
|
|
22-9
|
Daily physical education in schools
|
|
22-10
|
Physical activity in physical
education class
|
|
22-11
|
Television viewing
|
|
Access
|
|
22-12
|
School physical activity facilities
|
|
22-13
|
Worksite physical activity and
fitness
|
|
22-14
|
Community walking
|
|
22-15
|
Community bicycling
|
Target: 20
percent.
Baseline: 40
percent of adults aged 18 years and older engaged in no leisure-time physical
activity in 1997 (age adjusted to the year 2000 standard population).
Target setting
method: Better than the best.
Data source:
National Health Interview Survey (NHIS), CDC, NCHS.
|
Adults Aged 18 Years and
Older, 1997
|
No Leisure-Time Physical
Activity
|
|
Percent
|
|
TOTAL
|
40
|
|
Race and ethnicity
|
|
American Indian or Alaska Native
|
46
|
|
Asian or Pacific Islander
|
42
|
|
Asian
|
42
|
|
Native Hawaiian and other
Pacific
Islander
|
41
|
|
Black or African American
|
52
|
|
White
|
38
|
|
|
|
Hispanic or Latino
|
54
|
|
Not Hispanic or Latino
|
38
|
|
Black or African American
|
52
|
|
White
|
36
|
|
Gender
|
|
Female
|
43
|
|
Male
|
36
|
|
Education level (aged 25 years and older)
|
|
Less
than 9th grade
|
73
|
|
Grades
9 through 11
|
59
|
|
High
school graduate
|
46
|
|
Some
college or AA degree
|
35
|
|
College
graduate or above
|
24
|
|
Geographic location
|
|
Urban
|
39
|
|
Rural
|
43
|
|
Disability status
|
|
Persons with disabilities
|
56
|
|
Persons without disabilities
|
36
|
|
Select populations
|
|
Age groups
|
|
18
to 24 years
|
31
|
|
25
to 44 years
|
34
|
|
45
to 64 years
|
42
|
|
65
to 74 years
|
51
|
|
75
years and older
|
65
|
|
Persons with arthritis symptoms
|
43
|
|
Persons without arthritis symptoms
|
38
|
DNA = Data have not been analyzed. DNC = Data are not
collected. DSU = Data are statistically unreliable.
Note: Age adjusted to the year 2000 standard population.
Target: 30
percent.
Baseline: 15
percent of adults aged 18 years and older engaged in moderate physical activity
for at least 30 minutes 5 or more days per week in 1997 (age adjusted to the
year 2000 standard population).
Target setting
method: Better than the best.
Data source:
National Health Interview Survey (NHIS), CDC, NCHS.
|
Adults Aged 18 Years and
Older, 1997
|
22-2.
30 Minutes of
Activity 5 or More
Days per Week
|
20 Minutes of
Activity 3 or More
Days per Week*
|
|
Percent
|
|
TOTAL
|
15
|
31
|
|
Race and ethnicity
|
|
American Indian or Alaska Native
|
13
|
25
|
|
Asian or Pacific Islander
|
15
|
30
|
|
Asian
|
15
|
30
|
|
Native Hawaiian and other Pacific
Islander
|
11
|
31
|
|
Black or African American
|
10
|
23
|
|
White
|
15
|
32
|
|
|
|
Hispanic or Latino
|
11
|
23
|
|
Not Hispanic or Latino
|
15
|
32
|
|
Black or African American
|
10
|
22
|
|
White
|
16
|
33
|
|
Gender
|
|
Female
|
13
|
30
|
|
Male
|
16
|
31
|
|
Education level (aged 25 years and older)
|
|
Less than 9th grade
|
7
|
13
|
|
Grades 9 through 11
|
11
|
21
|
|
High school graduate
|
14
|
28
|
|
Some college or AA degree
|
17
|
34
|
|
College graduate or above
|
17
|
38
|
|
Geographic location
|
|
Urban
|
15
|
31
|
|
Rural
|
15
|
30
|
|
Disability status
|
|
Persons with disabilities
|
12
|
23
|
|
Persons without disabilities
|
16
|
33
|
|
Select populations
|
|
Age groups
|
|
18 to 24 years
|
17
|
36
|
|
25 to 44 years
|
15
|
31
|
|
45 to 64 years
|
14
|
30
|
|
65 to 74 years
|
16
|
31
|
|
75 years and older
|
12
|
23
|
|
Persons with arthritis symptoms
|
15
|
29
|
|
Persons without arthritis symptoms
|
15
|
32
|
DNA = Data have not been analyzed. DNC = Data are not
collected. DSU = Data are statistically unreliable.
Note: Age adjusted to the year 2000 standard population.
*Data for 20 minutes of activity 3 or more days per week are
displayed to further characterize the issue.
Target: 30
percent.
Baseline: 23
percent of adults aged 18 years and older engaged in vigorous physical activity
3 or more days per week for 20 or more minutes per occasion in 1997 (age
adjusted to the year 2000 standard population).
Target setting
method: Better than the best.
Data source:
National Health Interview Survey (NHIS), CDC, NCHS.
|
Adults Aged 18 Years and Older, 1997
|
Vigorous Physical
Activity
|
|
Percent
|
|
TOTAL
|
23
|
|
Race and ethnicity
|
|
American Indian or Alaska Native
|
19
|
|
Asian or Pacific Islander
|
17
|
|
Asian
|
16
|
|
Native Hawaiian and other Pacific
Islander
|
24
|
|
Black or African American
|
17
|
|
White
|
24
|
|
|
|
Hispanic
or Latino
|
16
|
|
Not Hispanic or Latino
|
24
|
|
Black or African American
|
17
|
|
White
|
25
|
|
Gender
|
|
Female
|
20
|
|
Male
|
26
|
|
Education level (aged 25 years and older)
|
|
Less than 9th grade
|
6
|
|
Grades 9 through 11
|
12
|
|
High school graduate
|
18
|
|
Some college or AA degree
|
24
|
|
College graduate and above
|
32
|
|
Geographic location
|
|
Urban
|
24
|
|
Rural
|
21
|
|
Disability status
|
|
Persons with disabilities
|
13
|
|
Persons without disabilities
|
25
|
|
Select populations
|
|
Age groups
|
|
18
to 24 years
|
32
|
|
25
to 44 years
|
27
|
|
45
to 64 years
|
21
|
|
65 to 74 years
|
13
|
|
75 years and older
|
6
|
|
Persons
with arthritis symptoms
|
21
|
|
Persons
without arthritis symptoms
|
24
|
DNA = Data have not been
analyzed. DNC = Data are not collected. DSU = Data are statistically
unreliable.
Note: Age adjusted to the year 2000 standard population.
The adoption and maintenance
of regular physical activity represent an important component of any health
regime and provide multiple opportunities to improve and maintain health.
Because the highest risk of death and disability is found among those who do no
regular physical activity, engaging in any amount of physical activity is
preferable to none. Physical activity should be encouraged as part of a daily
routine. While moderate physical activity for at least 30 minutes a day is
preferable, intermittent physical activity also increases caloric expenditure
and may be important for those who cannot fit 30 minutes of sustained activity
into their daily schedules. For even greater health benefits, vigorous physical
activity is necessary. For most persons, the greatest opportunity for physical
activity is associated with leisure time, because few occupations today provide
sufficient vigorous or moderate physical activity to produce health benefits.
Engaging in moderate
physical activity for at least 30 minutes per day will help ensure that
sufficient calories are used to provide health benefits. A minimum level of
intensity (for example, a brisk walk for 30 minutes per day) would, for most
persons, result in an energy expenditure of about 600 to 1,100 calories per
week.[18]
If calorie intake remains constant, this expenditure translates into a weight
loss of roughly one-sixth to one-third pound per week. Increases in daily
activity to ensure a weekly expenditure of 1,000 calories would have
significant individual and public health benefit for CHD prevention and deaths
from all causes, especially for persons who are sedentary. Furthermore, this
level of activity is feasible for most people even though the relative
intensity of any activity will vary by age. Starting out slowly and gradually
increasing the frequency and duration of physical activity is the key to successful
behavior change. In the case of walking, the message becomes, “If you are not
used to daily walking, then walk slowly and take short, frequent walks,
gradually increasing distance and speed.”
Target: 30
percent.
Baseline: 18
percent of adults aged 18 years and older performed physical activities that enhance and maintain strength and endurance 2 or more days per
week in 1998 (age adjusted to the year 2000 standard population).
Target setting
method: Better than the best.
Data source:
National Health Interview Survey (NHIS), CDC, NCHS.
|
Adults Aged 18 Years and
Older, 1998 (unless noted)
|
Strengthening and
Endurance
Exercises
|
|
Percent
|
|
TOTAL
|
18
|
|
Race
and ethnicity
|
|
American
Indian or Alaska Native
|
18
|
|
Asian
or Pacific Islander
|
17
|
|
Asian
|
17
|
|
Native Hawaiian and other Pacific
Islander
|
19
|
|
Black or African American
|
16
|
|
White
|
18
|
|
|
|
Hispanic or Latino
|
13
|
|
Not Hispanic or Latino
|
18
|
|
Black or African American
|
15
|
|
White
|
19
|
|
Gender
|
|
Female
|
14
|
|
Male
|
21
|
|
Education level (aged 25 years and older)
|
|
Less than 9th grade
|
4
|
|
Grades 9 through 11
|
8
|
|
High school graduate
|
11
|
|
Some college or AA degree
|
19
|
|
College graduate and above
|
26
|
|
Geographic location
|
|
Urban
|
19
|
|
Rural
|
15
|
|
Disability status
|
|
Persons with disabilities
|
14
(1997)
|
|
Persons without disabilities
|
20
(1997)
|
|
Select populations
|
|
Age Groups
|
|
18 to 24 years (not age adjusted)
|
28
|
|
25 to 44 years (not age adjusted)
|
21
|
|
45 to 64 years (not age adjusted)
|
14
|
|
65 to 74 years (not age adjusted)
|
10
|
|
75 years and older (not age adjusted)
|
7
|
|
Persons with arthritis symptoms
|
18
|
|
Persons without arthritis symptoms
|
18
|
DNA = Data have not been analyzed. DNC = Data are not
collected. DSU = Data are statistically unreliable.
Note: Age adjusted to the year 2000 standard population.
Target: 43
percent.
Baseline: 30
percent of adults aged 18 years and older did stretching exercises in the past
2 weeks in 1998 (age adjusted to the year 2000 standard population).
Target
setting method: Better than the best.
Data source: National
Health Interview Survey (NHIS), CDC, NCHS.
|
Adults Aged 18 Years and
Older, 1998 (unless noted)
|
Stretching
Exercises
|
|
Percent
|
|
TOTAL
|
30
|
|
Race and ethnicity
|
|
American Indian or Alaska Native
|
26
|
|
Asian or Pacific Islander
|
34
|
|
Asian
|
34
|
|
Native Hawaiian and other Pacific
Islander
|
42
|
|
Black or African American
|
26
|
|
White
|
30
|
|
|
|
Hispanic or Latino
|
22
|
|
Not Hispanic or Latino
|
31
|
|
Black or African American
|
27
|
|
White
|
31
|
|
Gender
|
|
Female
|
30
|
|
Male
|
30
|
|
Family income level
|
|
Below poverty
|
21
|
|
Near poverty
|
24
|
|
Middle/high income
|
34
|
|
Education level (aged 25 years and older)
|
|
Less than high school
|
16
|
|
High school graduate
|
23
|
|
At least some college
|
36
|
|
Geographic location
|
|
Urban
|
32
|
|
Rural
|
25
|
|
Disability status
|
|
Persons with activity limitations
|
29
(1995)
|
|
Persons without activity limitations
|
31
(1995)
|
|
Select populations
|
|
Age groups
|
|
18
to 24 years
|
36
|
|
25
to 44 years
|
32
|
|
45
to 64 years
|
28
|
|
65
to 74 years
|
24
|
|
75
years and older
|
22
|
|
Persons with arthritis symptoms
|
DNA
|
|
Persons without arthritis symptoms
|
DNA
|
DNA = Data have not been analyzed. DNC = Data are not
collected. DSU = Data are statistically unreliable.
Note: Age adjusted to the year 2000 standard population.
All
adults could benefit from physical activities designed to ensure functional
independence throughout life. The specific physical fitness components that provide
continued physical function as persons age include muscular strength/endurance
and flexibility. Examples of these activities include weight training,
resistance activities (using elastic bands or dumbbells), and stretching
exercises (such as static stretching, yoga, or T’ai Chi Chuan).
Effective
treatment of many chronic diseases and disorders has resulted in more years of
life, but many of these extra years are spent with disabling conditions that
prevent independent living and reduce the quality of life. Strengthening activities,
while important for all age groups, are particularly important for older
adults. Muscle strength declines with age, and there is a demonstrated
relationship between muscle strength and physical function.[19]
Age-related loss of strength may be lessened by strengthening exercises,
enabling an individual to maintain a threshold level of strength necessary to
perform basic weight-bearing activities, such as walking.[20], [21]
Strength training also has been shown to preserve bone density in
postmenopausal women.9
Physical
activities that improve muscular strength/endurance and flexibility also
improve the ability to perform tasks of daily living and may improve balance,
thus preventing falls.1
Activities of daily living have been identified as a scale to measure
dependencies in basic self-care and other functions important for independent
living and to avoid institutionalization. The performance of routine daily activities
is particularly important to maintaining functional independence and social integration
in older adults.11
Although
flexibility may appear to be a minor component of physical fitness, the
consequence of rigid joints affects all aspects of life, including walking,
stooping, sitting, avoiding falls, and driving a vehicle. Lack of joint
flexibility may adversely affect quality of life and will lead to eventual
disability.[22] Activities
such as static stretching or T’ai Chi Chuan routines, which consist of slow,
graceful movements with low impact, have great promise for maintaining
flexibility and can be appropriate for adults of any age.[23]
Increasing public awareness of all these potential benefits of muscle
strengthening and flexibility activities—and developing and making quality
programs available and accessible—may encourage the pursuit of activities that
promote muscular strength/endurance and flexibility.
Target: 35
percent.
Baseline: 27
percent of students in grades 9 through 12 engaged in moderate physical
activity for at least 30 minutes on 5 or more of the previous 7 days in 1999.
Target setting
method: Better than the best.
Data source:
Youth Risk Behavior Surveillance System (YRBSS), CDC, NCCDPHP.
|
Students in Grades 9
Through 12, 1999 (unless noted)
|
Moderate Physical
Activity
|
|
22-6.
Both
Genders
|
Females*
|
Males*
|
|
Percent
|
|
TOTAL
|
27
|
24
|
29
|
|
Race and ethnicity
|
|
American Indian or Alaska
Native
|
DSU
|
DSU
|
DSU
|
|
Asian or Pacific Islander
|
DSU
|
DSU
|
DSU
|
|
Asian
|
DSU
|
DSU
|
DSU
|
|
Native Hawaiian and other Pacific Islander
|
DSU
|
DSU
|
DSU
|
|
Black or African American
|
17
|
17
|
24
|
|
White
|
27
|
27
|
31
|
|
|
|
Hispanic or Latino
|
21
|
17
|
26
|
|
Not Hispanic or Latino
|
27
|
25
|
30
|
|
Black or African American
|
21
|
18
|
24
|
|
White
|
29
|
26
|
32
|
|
Parents’ education level
|
|
Less than high school
|
25
(1997)
|
25
(1997)
|
24
(1997)
|
|
High school graduate
|
21
(1997)
|
20
(1997)
|
21
(1997)
|
|
At least some college
|
20
(1997)
|
19
(1997)
|
20
(1997)
|
|
Select populations
|
|
Grade levels
|
|
9th
grade
|
28
|
26
|
31
|
|
10th
grade
|
26
|
25
|
27
|
|
11th
grade
|
25
|
21
|
29
|
|
12th
grade
|
27
|
24
|
29
|
DNA = Data have not been analyzed. DNC = Data are not
collected. DSU = Data are statistically unreliable.
*Data for females and males are displayed to further
characterize the issue.
Target: 85
percent.
Baseline: 65
percent of students in grades 9 through 12 engaged in vigorous physical
activity 3 or more days per week for 20 or more minutes per occasion in 1999.
Target setting
method: Better than the best.
Data source: Youth Risk Behavior Surveillance System (YRBSS), CDC,
NCCDPHP.
Students in Grades 9
Through 12, 1999 (unless noted)
|
Vigorous Physical Activity
|
|
22-7.
Both
Genders
|
Females*
|
Males*
|
|
Percent
|
|
TOTAL
|
65
|
57
|
72
|
|
Race and ethnicity
|
|
American Indian or Alaska
Native
|
DSU
|
DSU
|
DSU
|
|
Asian or Pacific Islander
|
DSU
|
DSU
|
DSU
|
|
Asian
|
DSU
|
DSU
|
DSU
|
|
Native Hawaiian and other Pacific Islander
|
DSU
|
DSU
|
DSU
|
|
Black or African American
|
56
|
49
|
64
|
|
White
|
68
|
60
|
75
|
|
|
|
Hispanic or Latino
|
61
|
50
|
72
|
|
Not Hispanic or Latino
|
65
|
58
|
73
|
|
Black or African American
|
56
|
47
|
65
|
|
White
|
67
|
60
|
75
|
|
Parents’ education
level
|
|
Less
than high school
|
50
(1997)
|
43
(1997)
|
60
(1997)
|
|
High
school graduate
|
54
(1997)
|
45
(1997)
|
62
(1997)
|
|
At
least some college
|
68
(1997)
|
57
(1997)
|
75
(1997)
|
|
Select populations
|
|
Grade Levels
|
|
9th grade
|
73
|
68
|
77
|
|
10th grade
|
65
|
56
|
73
|
|
11th
grade
|
58
|
49
|
67
|
|
12th
grade
|
61
|
52
|
71
|
DNA = Data have not been analyzed. DNC = Data are not
collected. DSU = Data are statistically unreliable.
*Data for females and males are displayed to further
characterize the issue.
Target and
baseline:
|
Objective
|
Increase in Schools Requiring Daily Physical Activity for All Students
|
1994
Baseline
|
2010
Target
|
|
|
|
Percent
|
|
22-8a.
|
Middle and junior high schools
|
17
|
25
|
|
22-8b.
|
Senior high schools
|
2
|
5
|
Target setting
method: 47 percent improvement for middle and junior high schools; 150
percent improvement for senior high schools.
Data source:
School Health Policies and Programs Study (SHPPS), CDC, NCCDPHP.
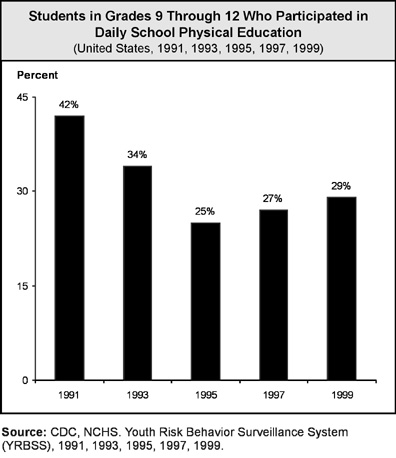
Target: 50
percent.
Baseline: 29
percent of students in grades 9 through 12 participated in daily school
physical education in 1999.
Target setting
method: Better than the best.
Data source:
Youth Risk Behavior Surveillance System (YRBSS), CDC, NCCDPHP.
|
Students in Grades 9
Through 12, 1999 (unless noted)
|
Daily
School Physical Education
|
|
22-9.
Both
Genders
|
Females*
|
Males*
|
|
Percent
|
|
TOTAL
|
29
|
26
|
32
|
|
Race and ethnicity
|
|
American Indian or Alaska
Native
|
DSU
|
DSU
|
DSU
|
|
Asian or Pacific Islander
|
DSU
|
DSU
|
DSU
|
|
Asian
|
DSU
|
DSU
|
DSU
|
|
Native Hawaiian and other Pacific Islander
|
DSU
|
DSU
|
DSU
|
|
Black or African American
|
28
|
25
|
33
|
|
White
|
28
|
26
|
31
|
|
|
|
Hispanic or Latino
|
40
|
36
|
45
|
|
Not Hispanic or Latino
|
28
|
25
|
30
|
|
Black or African American
|
29
|
26
|
33
|
|
White
|
28
|
26
|
31
|
|
Parents’ education level
|
|
Less than high school
|
29
(1997)
|
28
(1997)
|
30
(1997)
|
|
High school graduate
|
24
(1997)
|
22
(1997)
|
27
(1997)
|
|
At least some college
|
28
(1997)
|
25
(1997)
|
30
(1997)
|
|
Select populations
|
|
Grade
levels
|
|
9th grade
|
42
|
40
|
44
|
|
10th grade
|
30
|
28
|
33
|
|
11th grade
|
20
|
17
|
24
|
|
12th grade
|
20
|
17
|
24
|
DNA = Data have not been analyzed. DNC = Data are not
collected. DSU = Data are statistically unreliable.
*Data for females and males are displayed to further
characterize the issue.
Target: 50
percent.
Baseline: 38 percent of students in grades 9 through 12 were
physically active
in physical education class more than 20 minutes 3 to 5 days per week in 1999.
Target setting method: Better than the best.
Data source:
Youth Risk Behavior Surveillance System (YRBSS), CDC, NCCDPHP.
|
Students in Grades 9
Through 12, 1999 (unless noted)
|
Physically Active in
Physical
Education Classes
|
|
22-10.
Both
Genders
|
Females*
|
Males*
|
|
Percent
|
|
TOTAL
|
38
|
32
|
45
|
|
Race and ethnicity
|
|
American Indian or Alaska
Native
|
DSU
|
DSU
|
DSU
|
|
Asian or Pacific Islander
|
DSU
|
DSU
|
DSU
|
|
Asian
|
DSU
|
DSU
|
DSU
|
|
Native Hawaiian and other Pacific
Islander
|
DSU
|
DSU
|
DSU
|
|
Black or African American
|
32
|
24
|
41
|
|
White
|
40
|
33
|
46
|
|
|
|
Hispanic or Latino
|
41
|
35
|
47
|
|
Not Hispanic or Latino
|
38
|
31
|
45
|
|
Black or African American
|
32
|
25
|
37
|
|
White
|
40
|
33
|
45
|
|
Parents’ education level
|
|
Less than high school
|
28
(1997)
|
25
(1997)
|
32
(1997)
|
|
High school graduate
|
29
(1997)
|
24
(1997)
|
35
(1997)
|
|
At least some college
|
33
(1997)
|
27
(1997)
|
37
(1997)
|
|
Select populations
|
|
Grade levels
|
|
9th
grade
|
55
|
48
|
62
|
|
10th
grade
|
41
|
35
|
47
|
|
11th
grade
|
29
|
24
|
35
|
|
12th
grade
|
24
|
16
|
32
|
DNA = Data have not been analyzed. DNC = Data are not
collected. DSU = Data are statistically unreliable.
*Data for females and males are displayed to further
characterize the issue.
Target: 75
percent.
Baseline: 57
percent of students in grades 9 through 12 viewed television 2 or fewer hours
per school day in 1999.
Target setting
method: Better than the best.
Data source:
Youth Risk Behavior Surveillance System (YRBSS), CDC, NCCDPHP.
|
Students in Grades 9 through 12, 1999
|
Television
2 or Fewer Hours
per School Day
|
|
Percent
|
|
TOTAL
|
57
|
|
Race and ethnicity
|
|
American Indian or Alaska Native
|
DSU
|
|
Asian or Pacific Islander
|
DSU
|
|
Asian
|
DSU
|
|
Native Hawaiian and other Pacific
Islander
|
DSU
|
|
Black or African American
|
28
|
|
White
|
66
|
|
|
|
Hispanic or Latino
|
48
|
|
Not Hispanic or Latino
|
DNA
|
|
Black or African American
|
26
|
|
White
|
66
|
|
Gender
|
|
Female
|
59
|
|
Male
|
56
|
|
Parents’ education level
|
|
Less than high school
|
DNC
|
|
High school graduate
|
DNC
|
|
At least some college
|
DNC
|
|
Select populations
|
|
Grade levels
|
|
9th grade
|
49
|
|
10th grade
|
54
|
|
11th grade
|
62
|
|
12th grade
|
67
|
DNA = Data have not been analyzed. DNC = Data are not
collected. DSU = Data are statistically unreliable.
The health benefits of
moderate and vigorous physical activity are not limited to adults. Physical
activity among children and adolescents is important because of the related
health benefits (cardiorespiratory function, blood pressure control, and weight
management) and because a physically active lifestyle adopted early in life may
continue into adulthood. Even among children aged 3 to 4 years, those who were
less active tended to remain less active after age 3 years than most of their
peers.[24]
These findings highlight the need for parents, educators, and health care
providers to become positive role models and to be involved actively in the promotion
of physical activity and fitness in children and adolescents.
Many children are less
physically active than recommended, and physical activity declines during
adolescence.[25], [26]
One study found that one-quarter of U.S. children spend 4 hours or more
watching television daily.[27] Schools are an efficient vehicle for
providing physical activity and fitness instruction because they reach most
children and adolescents. Participation in school physical education ensures a
minimum amount of physical activity and provides a forum to teach physical
activity strategies and activities that can be continued into adulthood.
Findings suggest that the quantity and, in particular, the quality of school
physical education programs have a significant positive effect on the
health-related fitness of children and adolescents by increasing their
participation in moderate to vigorous activities.[28], [29]
Studies have shown that
spending 50 percent of physical education class time on physical activity is an
ambitious but feasible target. Being active for at least half of physical
education class time on at least half of the school days would provide a
substantial portion of the physical activity time recommended for adolescents.[30]
To achieve the benefits of school-based physical education equitably for all
children, daily adaptive physical education programs should be available for
children with special needs. School physical education requirements also are
recommended for students in preschool and postsecondary programs.[31]
Physical education is the
primary source of physical activity and fitness instruction. Health education
and other courses, however, can highlight the importance of physical activity
as a component of a healthy lifestyle. A well-designed health education
curriculum can help students develop the knowledge, attitudes, behavioral
skills, and confidence needed to adopt and maintain physically active lifestyles.31 To maximize classroom time, instruction on physical activity also can be
integrated into the lesson plans of other school subjects, such as mathematics,
biology, and language arts. Programs that have included classroom instruction
in physical activity have been effective in enhancing students’ physical activity-related
knowledge,[32] attitudes,[33]
behavior,[34] and
physical fitness.[35] (See Focus
Area 7. Educational and Community-Based Programs.)
Potential data
source: School Health Policies and Programs Study (SHPPS), CDC, NCCDPHP.
Target: 75
percent.
Baseline: 46
percent of worksites with 50 or more employees offered physical activity and/or
fitness programs at the worksite or through their health plans in 1998–1999.
|
Worksite Size
|
Worksite
or Health Plan
|
Health
Plan
|
Worksite
|
|
Percent
|
|
Total (50 or more employees)
|
46
|
22
|
36
|
|
50 to 99 employees
|
38
|
21
|
24
|
|
100 to 249 employees
|
42
|
20
|
31
|
|
250 to 749 employees
|
56
|
25
|
44
|
|
750 or more employees
|
68
|
27
|
61
|
|
Less than 50 employees
|
Developmental
|
Target setting
method: Better than the best.
Data source:
National Worksite Health Promotion Survey, Association for
Worksite Health Promotion (AWHP).
Participation in regular
physical activity depends, in part, on the availability and proximity of
community facilities and on environments conducive to physical activity.
Studies of adult participation in physical activity have found that use
generally decreases as facility distance from a person’s residence increases.[36]
People are unlikely to use community resources located more than a few miles
away by car or more than a few minutes away by biking or walking.
One of the major barriers to
youth participation in sports is lack of enough sports facilities.[37] Increased access to community
physical activity facilities would, therefore, help increase youth physical
activity. The availability of school facilities for physical activity programs
also may be beneficial for crime and violence prevention and other social
programs,37
because most juvenile crime is committed between 3 and 8 p.m.
Schools need to work with
community coalitions and community-based physical activity programs to take
maximum advantage of school facilities for the benefit of children and
adolescents and the community as a whole. The needs of all community members,
including senior citizens and people with disabilities, need to be considered.
Worksite physical activity
and fitness programs provide a mechanism for reaching large numbers of adults
and have at least short-term effectiveness in increasing the physical activity
and fitness of program participants.[38]
Such programs should be provided in a culturally and linguistically competent
manner. Evidence that worksite programs are cost-effective is growing. Such
programs may even reduce employer costs for insurance premiums, disability
benefits, and medical expenses.[39] Additional benefits for employers
include increased productivity, reduced absenteeism, reduced employee turnover,
improved morale, enhanced company image, and enhanced recruitment. Including
family members and retirees in worksite programs can further increase benefits
to employers and the community.39
As purchasers of group
health and life insurance plans, employers can design employee benefit packages
that include coverage for fitness club membership fees and community-based
fitness classes. Employers also can offer reduced insurance premiums and rebates
for employees who participate regularly in worksite fitness programs or who can
document participation in regular physical activity.
Target and
baseline:
|
Objective
|
Increase in Trips
Made by Walking
|
Length of Trip
|
1995
Baseline*
|
2010
Target
|
|
Percent
|
|
22-14a.
|
Adults aged 18 years and
older
|
Trips of 1 mile
or less
|
17
|
25
|
|
22-14b.
|
Children and adolescents
aged 5 to15 years
|
Trips to school of
1 mile or less
|
31
|
50
|
*Age adjusted to the year 2000 standard population.
Target setting
method: 47 percent improvement for 22-14a and 68 percent improvement for
22-14b. (Better than the best will be used when data are available.)
Data source:
Nationwide Personal Transportation Survey (NPTS), DOT.
|
Adults Aged 18 Years and
Older, 1995
|
22-14a.
Trips of 1 Mile or Less Made by Walking
|
|
Percent
|
|
TOTAL
|
17
|
|
Race and ethnicity
|
|
American Indian or Alaska Native
|
DNC
|
|
Asian or Pacific Islander
|
DNC
|
|
Asian
|
DNC
|
|
Native Hawaiian and other Pacific
Islander
|
DNC
|
|
Black or African American
|
DNC
|
|
White
|
DNC
|
|
|
|
Hispanic or Latino
|
DNC
|
|
Not Hispanic or Latino
|
DNC
|
|
Black or African American
|
DNC
|
|
White
|
DNC
|
|
Gender
|
|
Female
|
17
|
|
Male
|
16
|
|
Education level
|
|
Less than high school
|
20
|
|
High school graduate
|
14
|
|
At least some college
|
18
|
|
Geographic location
|
|
Urban
|
18
|
|
Rural
|
9
|
|
Select populations
|
|
Age groups
|
|
18
to 24 years
|
22
|
|
25
to 44 years
|
17
|
|
45
to 64 years
|
14
|
|
65
to 74 years
|
16
|
|
75
years and older
|
19
|
DNA = Data have not been analyzed. DNC = Data are not
collected. DSU = Data are statistically unreliable.
Note: Age adjusted to the year 2000 standard population.
|
Children and Adolescents
Aged 5 to 15 Years, 1995
|
22-14b.
Trips to School of 1 Mile or Less Made by Walking
|
|
Percent
|
|
TOTAL
|
31
|
|
Race and ethnicity
|
|
American Indian or Alaska Native
|
DNC
|
|
Asian or Pacific Islander
|
DNC
|
|
Asian
|
DNC
|
|
Native Hawaiian and other Pacific
Islander
|
DNC
|
|
Black or African American
|
DNC
|
|
White
|
DNC
|
|
|
|
Hispanic
or Latino
|
DNC
|
|
Not Hispanic or Latino
|
DNC
|
|
Black or African American
|
DNC
|
|
White
|
DNC
|
|
Gender
|
|
Female
|
27
|
|
Male
|
35
|
|
Parents’ education level
|
|
Less than high school
|
DNC
|
|
High school graduate
|
DNC
|
|
At least some college
|
DNC
|
|
Geographic location
|
|
Urban
|
32
|
|
Rural
|
27
|
|
Select populations
|
|
Age groups
|
|
5
to 9 years
|
27
|
|
10
to 15 years
|
35
|
DNA = Data have not been analyzed. DNC = Data are not
collected. DSU = Data are statistically unreliable.
Note: Age adjusted to the year 2000 standard population.
Walking
is a very popular form of physical activity in the United States; however,
people need the opportunity to walk safely. Over 75 percent of all trips less
than 1 mile were made by automobile in 1995.[40] In addition, the number of
walking trips as a percentage of all trips taken (of any distance) has declined
over the years. Walking trips made by adults dropped from 9.3 percent in 1977
to 7.2 percent in 1990 and again to 5.4 percent in 1995. Walking has declined
even more sharply for children.40
These declines have negative implications for the health of adults and children.
Target and
baseline:
|
Objective
|
Increase in Trips
Made by Bicycling
|
Activity
|
1995
Baseline*
|
2010
Target
|
|
Percent
|
|
22-15a.
|
Adults aged 18 years and
older
|
Trips of 5 miles
or less
|
0.6
|
2.0
|
|
22-15b.
|
Children and adolescents
aged 5 to15 years
|
Trips to school of
2 miles or less
|
2.4
|
5.0
|
|
|
|
|
|
|
*Age adjusted to the year 2000 standard population.
Target setting
method: 233 percent improvement for 22-15a and 108 percent improvement for
22-15b. (Better than the best will be used when data are available.)
Data source: Nationwide
Personal Transportation Survey (NPTS), DOT.
|
Adults Aged 18 Years and
Older, 1995
|
22-15a.
Trips of 5 Miles or Less Made by
Bicycling
|
|
Percent
|
|
TOTAL
|
0.6
|
|
Race and ethnicity
|
|
American Indian or Alaska Native
|
DNC
|
|
Asian or Pacific Islander
|
DNC
|
|
Asian
|
DNC
|
|
Native Hawaiian and other Pacific
Islander
|
DNC
|
|
Black or African American
|
DNC
|
|
White
|
DNC
|
|
|
|
Hispanic
or Latino
|
DNC
|
|
Not
Hispanic or Latino
|
DNC
|
|
Black or African American
|
DNC
|
|
White
|
DNC
|
|
Gender
|
|
Female
|
0.3
|
|
Male
|
0.9
|
|
Education
level
|
|
Less than high school
|
0.6
|
|
High school graduate
|
0.5
|
|
At least some college
|
0.6
|
|
Geographic location
|
|
Urban
|
0.6
|
|
Rural
|
0.3
|
|
Age groups
|
|
18 to 24 years
|
1.4
|
|
25 to 44 years
|
0.6
|
|
45 to 64 years
|
0.3
|
|
65 to 74 years
|
0.3
|
|
75 years and older
|
0.1
|
DNA = Data have not been analyzed. DNC = Data are not
collected. DSU = Data are statistically unreliable.
Note: Age adjusted to the year 2000 standard population.
Children and Adolescents
Aged 5 to 15 Years, 1995
|
22-15b.
Trips to School of 2 Miles or Less Made by Bicycling
|
|
Percent
|
|
TOTAL
|
2.4
|
|
Race and ethnicity
|
|
American Indian or Alaska Native
|
DNC
|
|
Asian or Pacific Islander
|
DNC
|
|
Asian
|
DNC
|
|
Native
Hawaiian and other Pacific Islander
|
DNC
|
|
Black
or African American
|
DNC
|
|
White
|
DNC
|
|
|
|
Hispanic
or Latino
|
DNC
|
|
Not Hispanic or Latino
|
DNC
|
|
Black or African American
|
DNC
|
|
White
|
DNC
|
|
Gender
|
|
Female
|
1.7
|
|
Male
|
3.2
|
|
Parents’ education level
|
|
Less than high school
|
DNC
|
|
High school graduate
|
DNC
|
|
At least some college
|
DNC
|
|
Geographic location
|
|
Urban
|
2.6
|
|
Rural
|
1.1
|
|
Select populations
|
|
Age groups
|
|
5
to 9 years
|
1.6
|
|
10
to 15 years
|
3.0
|
DNA = Data have not been analyzed. DNC = Data are not
collected. DSU = Data are statistically unreliable.
Note: Age adjusted to the year 2000 standard population.
Bicycling
is another form of transportation that may be used by both children and adults
for distances that may not be feasible, practical, or efficient to cover by
walking. If the environment does not provide safe opportunities for physical activities
such as walking and bicycling, adults and children likely will spend more time
engaging in sedentary activities indoors. (See Focus Area 8. Environmental
Health.) Sedentary activities such as watching television, playing video games,
and using personal computers have contributed to increases in the cases of overweight
individuals.27
 | |
1. |
Access to
Quality Health Services |
| |
2. |
Arthritis,
Osteoporosis, and Chronic Back Conditions |
|
|
|
|
| 2-2. | |
Activity
limitations due to arthritis |
| 2-3. | |
Personal care
limitations |
| 2-8. | |
Arthritis
education |
| 2-9. | |
Cases of
osteoporosis |
| 2-11. | |
Activity
limitations due to chronic back conditions |
| |
3. |
Cancer |
| |
4. |
Chronic
Kidney Disease |
| |
5. |
Diabetes |
|
|
|
|
| 5-1. | |
Diabetes
education |
| 5-2. | |
New cases of
diabetes |
| 5-3. | |
Overall cases of
diagnosed diabetes |
| 5-4. | |
Diagnosis of
diabetes |
| 5-5. | |
Diabetes deaths |
| 5-6. | |
Diabetes-related
deaths |
| 5-7. | |
Cardiovascular
disease deaths in persons with diabetes |
| |
6. |
Disability
and Secondary Conditions |
|
|
|
|
| 6-2. | |
Feelings and
depression among children with disabilities |
| 6-3. | |
Feelings and depression interfering with
activities among adults with disabilities |
| 6-4. | |
Social
participation among adults with disabilities |
| 6-9. | |
Inclusion of children and youth with
disabilities in regular education programs |
| 6-10. | |
Accessibility of
health and wellness programs |
| 6-12. | |
Environmental
barriers affecting participation in activities |
| 6-13. | |
Surveillance and health
promotion programs |
| |
7. |
Educational
and Community-Based Programs |
|
|
|
|
| 7-2. | |
School health
education |
| 7-3. | |
Health-risk
behavior information for college and university students |
| 7-5. | |
Worksite health
promotion programs |
| 7-6. | |
Participation in
employer-sponsored health promotion activities |
| 7-7. | |
Patient and
family education |
| 7-9. | |
Health care organization sponsorship of
community health promotion activities |
| 7-10. | |
Community health
promotion programs |
| 7-11. | |
Culturally appropriate and linguistically
competent community health promotion programs |
| 7-12. | |
Older adult
participation in community health promotion activities |
| |
8. |
Environmental
Health |
| |
9. |
Family
Planning |
|  |
11. |
Health
Communication |
| |
12. |
Heart Disease
and Stroke |
|
|
|
|
| 12-1. | |
Coronary heart
disease (CHD) deaths |
| 12-7. | |
Stroke deaths |
| 12-9. | |
High blood
pressure |
| 12-10. | |
High blood
pressure control |
| 12-11. | |
Action to help
control blood pressure |
| 12-13. | |
Mean total blood
cholesterol levels |
| 12-14. | |
High blood
cholesterol levels |
| 12-16. | |
LDL-cholesterol
level in CHD patients |
| |
15. |
Injury and
Violence Prevention |
|
|
|
|
| 15-1. | |
Nonfatal head
injuries |
| 15-2. | |
Nonfatal spinal
cord injuries |
| 15-13. | |
Deaths from
unintentional injuries |
| 15-14. | |
Nonfatal
unintentional injuries |
| 15-16. | |
Pedestrian deaths |
| 15-18. | |
Nonfatal
pedestrian injuries |
| 15-21. | |
Motorcycle helmet
use |
| 15-23. | |
Bicycle helmet use |
| 15-24. | |
Bicycle helmet
laws |
| 15-27. | |
Deaths from falls |
| 15-28. | |
Hip fractures |
| 15-29. | |
Drownings |
| 15-31. | |
Injury protection
in school sports |
| |
16. |
Maternal,
Infant, and Child Health |
| |
17. |
Medical
Product Safety |
| |
18. |
Mental Health
and Mental Disorders |
| |
19. |
Nutrition and
Overweight |
| |
20. |
Occupational
Safety and Health |
| |
23. |
Public Health
Infrastructure |
| |
24. |
Respiratory
Diseases |
|
|
|
|
| 24-1. | |
Deaths from
asthma |
| 24-2. | |
Hospitalizations
for asthma |
| 24-3. | |
Hospital
emergency department visits for asthma |
| 24-4. | |
Activity
limitations |
| 24-5. | |
School or work
days lost |
| 24-6. | |
Patient education |
| 24-7. | |
Appropriate
asthma care |
| |
25. |
Sexually
Transmitted Diseases |
| |
26. |
Substance
Abuse |
| |
27. |
Tobacco Use |
|
|
|
|
| 27-1. | |
Adult tobacco use |
| 27-2. | |
Adolescent tobacco use |
| 27-3. | |
Initiation of tobacco use |
| 27-4. | |
Age at first tobacco use |
| 27-5. | |
Smoking cessation by adults |
| 27-7. | |
Smoking cessation
by adolescents |
| |
28. |
Vision and
Hearing |
(A listing of abbreviations and acronyms used in this
publication appears in Appendix H.)
Aerobic: Conditions or processes that occur in the
presence of, or requiring, oxygen.[41]
Energy expenditure: The energy cost to the body of
physical activity, usually measured in kilocalories.41
Functional independence: The ability to perform
successfully and safely activities related to a daily routine with sufficient
energy, strength/endurance, flexibility, and coordination.
Physical activity: Bodily
movement that is produced by the contraction of skeletal muscle and that
substantially increases energy expenditure.1
Moderate
physical activity: Activities that use large muscle groups and are at least
equivalent to brisk walking. In addition to walking, activities may include
swimming, cycling, dancing, gardening and yardwork, and various domestic and
occupational activities.
Vigorous
physical activity: Rhythmic, repetitive physical activities that use large
muscle groups at 70 percent or more of maximum heart rate for age. An exercise
heart rate of 70 percent of maximum heart rate for age is about 60 percent of
maximal cardiorespiratory capacity and is sufficient for cardiorespiratory
conditioning. Maximum heart rate equals roughly 220 beats per minute minus age.
Examples of vigorous physical activities include jogging/running, lap swimming,
cycling, aerobic dancing, skating, rowing, jumping rope, cross-country skiing,
hiking/backpacking, racquet sports, and competitive group sports (for example,
soccer and basketball).
Physical fitness: A set of attributes that persons
have or achieve that relates to the ability to perform physical activity.1 Performance-related components of
fitness include agility, balance, coordination, power, and speed.[42]
Health-related components of physical fitness include body composition,
cardiorespiratory function, flexibility, and muscular strength/endurance.41
Agility: Ability to start,
stop, and move the body quickly and in different directions.
Balance:
Ability to maintain a certain posture or to move without falling.
Body
composition: The relative amount of body weight that is fat and nonfat.
Cardiorespiratory
function: A health-related component of physical fitness that relates to
the ability of the circulatory and respiratory systems to supply oxygen during
physical activity.
Coordination:
Ability to do a task integrating movements of the body and different parts of
the body.
Exercise
(exercise training): Planned, structured, and repetitive bodily movement
done to improve or maintain one or more components of physical fitness.
Flexibility:
Ability to move a joint through the full range of motion without discomfort or
pain.
Muscular
endurance: Ability of the muscle to perform repetitive contractions over a
prolonged period of time.
Muscular
strength: Ability of the muscle to generate the maximum amount of force.
Power:
Ability to exert muscular strength quickly.
Speed:
Ability to move the whole body quickly.
Sedentary: Denotes a
person who is relatively inactive and has a lifestyle characterized by a lot of
sitting.41
[1]
U.S. Department of Health and Human Services. Physical Activity and Health:
A Report of the Surgeon General. Atlanta, GA: Centers for Disease Control
and Prevention (CDC), National Center for Chronic Disease Prevention and Health
Promotion, 1996.
[2] Frost, H.; Moffett, J.A.K.; Moser, J.S.;
et al. Randomized controlled trial for evaluation of fitness programme
for patients with chronic low back pain. British Medical Journal 310:151-154,
1995.
PubMed; PMID 7833752
[3]
McTiernan, A.; Stanford, J.L.; Weiss, N.S.; et al. Occurrence of breast cancer
in relation to recreational exercise in women age 50-64 years. Epidemiology 7(6):598-604,
1996.
PubMed; PMID 8899385
[4] Kujala, U.M.; Kaprio, J.; Sarna, S.; et
al. Relationship of leisure-time physical activity and mortality: The
Finnish twin cohort. Journal of the American Medical Association 279(6):440-444,
1998.
PubMed; PMID 9466636
[5]
Paffenbarger, R.S.; Hyde, R.T.; Wing, A.L.; et al. The association of changes
in physical-activity level and other lifestyle characteristics with mortality
among men. New England Journal of Medicine 328(8):538-545, 1993.
PubMed; PMID 8426621
[6]
Sherman, S.E.; D’Agostino,
R.B.; Cobb, J.L.; et al. Physical activity and mortality in women in the
Framingham Heart Study. American Heart Journal 128(5):879-884, 1994.
PubMed; PMID 7942478
[7]
Kaplan, G.A.; Strawbridge, W.J.; Cohen, R.D.; et al. Natural history of
leisure-time physical activity and its correlates: Associations with mortality
from all causes and cardiovascular disease over 28 years. American Journal
of Epidemiology 144(8):793-797, 1996.
PubMed; PMID 8857282
[8]
Kushi, L.H.; Fee, R.M.; Folsom, A.R.; et al. Physical activity and mortality in
postmenopausal women. Journal of the American Medical Association 277:1287-1292,
1997.
PubMed; PMID 9109466
[9] Nelson, M.E.; Fiatarone, M.A.; Morganti,
C.M.; et al. Effects of high-intensity strength training on multiple
risk factors for osteoporotic fractures: A randomized controlled trial. Journal
of the American Medical Association 272(24):1909-1914, 1994.
PubMed; PMID 7990242
[10] LaCroix, A.Z.; Guralnik, J.M.; Berkman,
L.F.; et al. Maintaining mobility in late life. II. Smoking, alcohol
consumption, physical activity, and body mass index. American Journal of
Epidemiology 137(8):858-869, 1993.
PubMed; PMID 8484377
[11]
Buchner, D.M. Preserving mobility in older adults. Western Journal of Medicine
167(4):258-264, 1997.
PubMed; PMID 9348757
[12]
Stenstrom, C.H. Home exercise in rheumatoid arthritis functional class II: Goal
setting versus pain attention. Journal of Rheumatology 21(4):627-634,
1994.
PubMed; PMID 8035384
[13]
CDC. Prevalence of leisure-time physical activity among persons with arthritis
and other rheumatic conditions—United States, 1990–91. Morbidity and
Mortality Weekly Report 46(18):389-393, 1997.
PubMed; PMID 9157272
[14]
National Institutes of Health. Optimal calcium intake. In: NIH Consensus
Statement 12(4):1-31, 1994.
[15]
Snow-Harter, C.; Shaw, J.M.; and Matkin, C.C. Physical activity and risk
of osteoporosis. In: Marcus, R.; Feldman, D.; and Kelsey, J., eds. Osteoporosis.
San Diego, CA: Academic Press, 1996, 511-528.
[16] Pate, R.R.; Pratt, M.; Blair, S.N.; et
al. Physical activity and public health: A recommendation from the
Centers for Disease Control and Prevention and the American College of Sports
Medicine. Journal of the American Medical Association 273(5):402-407,
1995.
PubMed; PMID 7823386
[17]
President’s Council on
Physical Fitness and Sports. Physical Activity & Sport in the Lives of
Girls. Washington, DC: The President’s
Council on Physical Fitness and Sports, 1997.
[18] Stofan, J.R.; DiPietro, L.; Davis, D.; et
al. Physical activity patterns associated with cardiorespiratory fitness
and reduced mortality: The Aerobics Center Longitudinal Study. American
Journal of Public Health 88(12):1807-1813, 1998.
PubMed; PMID 9842378
[19]
Brown, M.; Sinacore, D.R.; and Host, H.H. The relationship of strength to
function in the older adult. Journal of Gerontology 50A:55-59, 1995.
PubMed; PMID 7493219
[20] Tseng, B.S.; Marsh, D.R.; Hamilton, M.T.;
et al. Strength and aerobic training attenuate muscle wasting and
improve resistance to the development of disability with aging. Journal of
Gerontology 50A:113-119, 1995.
PubMed; PMID 7493203
[21]
Evans, W.J. Effects of exercise on body composition and functional capacity of
the elderly. Journal of Gerontology 50A:147-150, 1995.
PubMed; PMID 7493209
[22]
Cunningham, D.A.; Paterson, D.H.; Hinmann, J.E.; et al. P.A. Determinants of
independence in the elderly. Canadian Journal of Applied Physiology 18(3):243-254,
1993.
PubMed; PMID 8242004
[23]
Lan, C.; Lai, J.S.; Chen, S.Y; et al. 12-month Tai Chi training in the elderly:
Its effect on health fitness. Medicine and Science in Sports and Exercise 30(3):345-351,
1997.
PubMed; PMID 9526879
[24] Pate, R.R.; Baranowski, T.; Dowda, M.; et
al. Tracking of physical activity in young children. Medicine and Science
in Sports and Exercise 28(1):92-96, 1996.
PubMed; PMID 8775360
[25]
Pate, R.R.; Long, B.J.; and Heath, G. Descriptive epidemiology of physical
activity in adolescents. Pediatric Exercise Science 6:434-447, 1994.
[26]
CDC. Youth risk behavior surveillance—United States, 1997. Morbidity and
Mortality Weekly Report 47(55-3):1-89, 1998.
PubMed; PMID 9719790
[27]
Anderson, R.E.; Crespo, C.J.; Bartlett, S.J.; et al. Relationship of physical
activity and television watching with body weight and level of fatness among
children: Results from the Third National Health and Nutrition Examination Survey.
Journal of the American Medical Association 279:938-942, 1998.
[28]
McKenzie, T.L.; Nader, P.R.; Strikmiller, P.K.; et al. School physical
education: Effect of the child and adolescent trial for cardiovascular health. Preventive
Medicine 25(4):423-431, 1996.
PubMed; PMID 8818066
[29] Sallis, J.F.; McKenzie, T.L.; Alcaraz,
J.E.; et al. The effects of a 2-year physical education program (SPARK)
on physical activity and fitness in elementary school students. American Journal
of Public Health 87(8):1328-1334, 1997.
PubMed; PMID 9279269
[30]
Sallis, J.F., and Patrick, K. Physical activity guidelines for adolescents:
Consensus statement. Pediatric Exercise Science 6:302-314, 1994.
[31]
CDC. Guidelines for school and community programs to promote lifelong physical
activity among young people. Morbidity and Mortality Weekly Report 46(RR-6):1-36,
1997.
PubMed; PMID 9072670
[32]
Killen, J.D.; Telch, M.J.; Robinson, T.N.; et al. Cardiovascular disease risk
reduction for tenth graders: A multiple-factor school-based approach. Journal
of the American Medical Association 260(12):1728-1733, 1988.
PubMed; PMID 3411756
[33]
Prokhorov, A.V.; Perry, C.L.; Kelder, S.H.; et al. Lifestyle values of
adolescents: Results from Minnesota Heart Health Youth Program. Adolescence
28(111):637-647, 1993.
PubMed; PMID 8237549
[34]
Kelder, S.H.; Perry, C.L.; and Klepp, K.I. Community-wide youth exercise
promotion: Long-term outcomes of the Minnesota Heart Health Program and the
Class of 1989 study. Journal of School Health 63(5):218-223, 1993.
PubMed; PMID 8336479
[35]
Arbeit, M.L.; Johnson, C.C.; and Mott, D.S. The Heart Smart Cardiovascular
School Health Promotion: Behavior correlates of risk factor change. Preventive
Medicine 21(1):18-32, 1992.
PubMed; PMID 1738766
[36] Sallis, J.F.; Hovell, M.F.; Hofstetter,
C.R.; et al. Distance between homes and exercise facilities related to
frequency of exercise among San Diego residents. Public Health Reports 105(2):179-185,
1990.
PubMed; PMID 2108465
[37]
Carnegie Council on Adolescent Development. A Matter of Time: Risk and
Opportunity in the Out-of-School Hours. Recommendations for Strengthening
Community Programs for Youth. New York, NY: Carnegie Corporation of New
York, 1994.
[38]
Cole, G.; Leonard, B.; Hammond, S.; et al. Using “stages of behavioral change”
constructs to measure the short-term effects of a worksite-based intervention
to increase moderate physical activity. Psychological Reports 82(2):615-618,
1998.
PubMed; PMID 9621738
[39]
Shephard, R.J. Employee health and fitness—state of the art. Preventive Medicine
12(5):644-653, 1983.
PubMed; PMID 6419221
[40]
U.S. Department of Transportation (DOT). National Bicycling and Walking
Study: Transportation Choices for a Changing America. Pub. FH10A PD 94-023.
Washington, DC: DOT, Federal Highway Administration, 1994.
[41]
Kent, M. The Oxford Dictionary of Sport’s
Science and Medicine. Oxford, England: Oxford University Press, 1994.
[42]
Howley, E.T., and Franks, B.O. Health Fitness Instructors Handbook. 3rd
ed. Champaign, IL: Human Kinetics, 1997.
Go
to Healthy People 2010 Volume II Table of Contents
Go
to main Table of Contents