
 |
|
 |
![]()

|
Outpatient
Department
Visit Data
The following figures
were excerpted from:
Middleton K, Hing E, Xu J. National Hospital Ambulatory Medical Care Survey:
2005 Outpatient Department Summary. Advance
data from
vital and health
statistics; no. 389. Hyattsville, Maryland: National Center for Health
Statistics. 2007.
![]()

Figure 1.
Annual rate of outpatient department visits by patient age and sex:
United States, 2005

Figure 2.
Percent distribution of outpatient department visits
to general medicine and pediatric clinics, by
whether the visit was to the patient's primary care
provider, according to expected source of payment: United States,
2005

Figure 3.
Percent distribution of outpatient department
visits by prior-visit
status during the last 12 months: United States, 2005
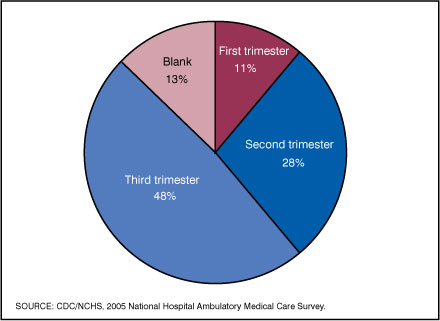
Figure 4.
Percent distribution of outpatient department
pregnancy-related visits by trimester: United
States, 2005
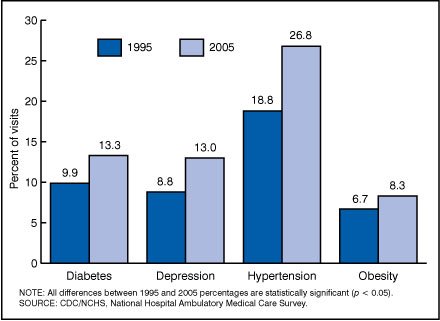
Figure 5.
Percentage of outpatient department visits
by adults 18 years and over with selected chronic conditions: United States, 1995
and 2005
NAMCS/NHAMCS Home | NAMCS
Participants |
This page last reviewed
October 15, 2008
|
