|
The United States
in a Changing World
Research and development in the United States has materially contributed
to innovation and economic growth. The strong U.S. economic performance
during the 1990s has given impetus to the trend toward a knowledge-based
economy: that is, one in which research, its commercial exploitation,
and other intellectual work play a growing role in driving economic
growth.
That strong U. S. performance has become the benchmark against
which governments around the world measure their countries' science
and technology (S&T) activities and their progress toward a
more knowledge-based economy. Seeking to emulate elements of the
U.S. model of knowledge-driven economic growth, they are striving
to expand knowledge intensive sectors of their economies and are
taking steps to develop the highly educated technical workforces
they need to do so. The European Union (EU) has set a goal of becoming
"the most competitive and dynamic knowledge-based economy in the
world by 2010."
U.S. investment and performance in R&D and S&T remain strong
and progress toward a more knowledge-based economy continues. This
progress takes place in an environment of increasing globalization
of S&T-related activities as advances in communication and transportation,
the cross-fertilization of ideas, increasingly open markets, and
responses to significant cost differentials among competing countries
spur innovation.
The United States has long benefited from the participation of
large numbers of foreign-born scientists and engineers in the S&E
workforce. Data from the 2000 U.S. Census show that in S&E occupations
approximately 17 percent of bachelor's degree holders, 29 percent
of master's degree holders, and 38 percent of doctorate holders
are foreign born. These individuals contribute talent, scientific
ingenuity, and technical sophistication to the U.S. S&T enterprise
and help open up avenues for international scientific cooperation.
The outlook for U.S. S&E is affected by uncertainties in three
major areas: the effects of policy adjustments arising from the
September 11, 2001, attacks, the current weak worldwide economy,
and developments affecting the U.S. S&E workforce.
The first source of uncertainty is the recasting of the relationship
between S&T and U.S. national security. The attacks of September
2001 have given increased urgency and a new focus to the changing
strategic role of S&T in the post-Cold War era. The role of
foreign students, scientists, and engineers in the U.S. S&E
system; the appropriate balance between security and openness in
scientific communication; the direction of certain Federal R&D
initiatives; and the contributions that R&D can make in the
domestic security arena are all issues of concern. The eventual
resolution of these issues and the related effects on the U.S. S&T
system remain unclear, particularly because only a few of the relevant
data series available at this writing cover the 2002–03 period.
A second source of uncertainty is the duration, depth, and eventual
effects of the current worldwide economic weakness. In particular,
the effect this weakness will have on the structure and activities
of high-technology firms around the world is unclear. As is the
case with the aftermath of September 11, only fragmentary trend
data are available that cover the 2002–03 period, and 1-year deviations
from these trends are difficult to interpret with confidence.
A third source of uncertainty is the effect of the continuing globalization
of labor markets on the U.S. knowledge-based economy. Employment
in the U.S. S&E workforce has been growing significantly faster
than overall employment for several decades (figure
O-1  ),
made possible in part by the U.S. ability to attract foreign-born
S&E workers. The U.S. S&E workforce is entering a period
of rising retirements, particularly among (but not limited to) doctorate
holders. If present degree trends, retirement behavior, and international
migration patterns persist, S&E workforce growth will slow considerably,
potentially affecting the relative technological position of the
U.S. economy. ),
made possible in part by the U.S. ability to attract foreign-born
S&E workers. The U.S. S&E workforce is entering a period
of rising retirements, particularly among (but not limited to) doctorate
holders. If present degree trends, retirement behavior, and international
migration patterns persist, S&E workforce growth will slow considerably,
potentially affecting the relative technological position of the
U.S. economy.
The international S&E labor force is growing and becoming increasingly
mobile. Governments are implementing policies designed to lure more
of their citizens into S&E; keep their researchers at home or,
in the case of the EU, in EU countries; and attract highly trained
S&E personnel from abroad. Private firms are responding to competitive
pressures and market opportunities by opening high-technology operations
in foreign locations, developing strategic international alliances,
and consummating cross-national spinoffs and mergers. A consequence
of these trends is the further spread of technological know-how
and the development of significant scientific and technical capacity
in new locations across the globe.
As with the uncertain implications of security concerns and the
weak economic environment, the dynamics of skilled labor migration
in the context of changing government and industry policies also
are hard to predict. Conclusions about their impact on the U.S.
S&T position may require the accumulation of several years'
worth of data to distinguish between temporary deviations from major
trends and changes in the trends themselves.
The remainder of this overview sets out the main U.S. S&E trends
in the context of national and international developments that affect
the knowledge-based economy in the United States. It begins by looking
at trends in R&D investment, discusses trends related to R&D
outputs and performance, and considers S&E labor force indicators.
The overview then examines two sectors of strategic importance to
the development and use of knowledge: the academic sector, including
Ph.D. employment, and the high-technology sector. It closes with
a summary consideration of U.S. S&T competitiveness in an uncertain
environment.
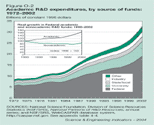
R&D Investment 
U.S. strength in S&T reflects many decades of government support
for the conduct of R&D, the development and maintenance of
the necessary infrastructure, and the education and training
of scientists and engineers. Federal R&D funds have been
especially important to the academic sector, which is the source
of much of the nation's
basic research. Federal funds constituted close to 60 percent of
academic R&D expenditures in the past decade. Since 1990,
inflation-adjusted Federal dollars for academic R&D have
grown continuously, increasing by about 66 percent through 2002.
Real support to all other sectors declined during the decade,
rebounding from its 2000 low but still contracting by about
14 percent over the period (figure
O-2 ).
The strong U.S. R&D investment also reflects industry's commitment
to R&D as an engine of competitive strength and profit growth.
Company-funded R&D, which first surpassed federally funded R&D
in 1980, reached a record $180 billion in 2000. Although it has
slowed down sharply, it remained near this level in the face of
2 years of economic weakness. In 2002, U.S.-based firms spent an
estimated $177 billion of their own funds on R&D, providing
two thirds of the national total of $276 billion (figure
O-3 ).
This continued strength in industry spending for R&D—combined
with an upswing in Federal Government support that mainly reflects
increases in health-related R&D—has allowed the United
States to maintain its longtime preeminence in the world's R&D
activities. In 2001, the last year with internationally comparable
data, U.S. R&D accounted for 44 percent of the combined R&D
spending of the 30 member countries of the Organisation for Economic
Cooperation and Development (OECD). The United States spent nearly
three times as much on R&D as Japan, the nation with the second-highest
total R&D expenditure. The U.S. total is half again as much
as all EU countries combined and more than the combined total
of the other G-7 countries [Japan, the United Kingdom (U.K.), Canada,
France, Germany, and Italy]. Relative to U.S. R&D expenditures,
the EU and all of these countries except Canada lost ground over
the period (figure O-4
).
A significant development in industrial R&D performance in
the United States (and to a lesser extent elsewhere) is the growth
of R&D carried out in service-sector industries. Computer software
firms and companies performing R&D on a contract basis primarily
led this growth. U.S. service sector R&D volume surged during
the late 1980s and early 1990s and again after 1997.
In contrast to the United States, manufacturing industries—chiefly
electronics, chemicals, motor vehicles, and electrical machinery—carry
out almost all R&D in Japan. The EU shows a trend toward an
increasing share of R&D by service-sector industries, but it
remains well below 15 percent of the total (figure
O-5 ).
The R&D environment has changed in response to developing global
markets; closer links between R&D and the creation of new products,
services, and markets; and the opportunities offered by advances
in information and communication technologies. Industry has responded
by outsourcing R&D both nationally and internationally, opening
overseas operations, forming strategic technology alliances with
U.S. and international partners, and engaging in both divestiture
and acquisition of strategic technology units. U.S.-based companies
have a prominent role in international alliances: the bulk of these
strategic technology alliances have a U.S.-based firm as the ultimate
parent company (figure O-6
).
The United States has also fostered the development of university-industry
links and has stimulated the commercialization of "public" (mostly
academic) research.
R&D Performance,
Outputs, and Capabilities
The strength of the R&D performance of U.S.-based companies
has attracted the attention of firms elsewhere. U.S. affiliates
of foreign firms are increasing funds to conduct R&D in this
country. In the late 1980s, U.S. companies provided $7.9 billion
to their overseas affiliates for R&D, whereas foreign companies
provided $6.7 billion to their U.S.-based affiliates. However, in
the 1990s, these R&D investment trends reversed.
By 2000, R&D expenditures by foreign-owned firms in the United
States had reached almost $26 billion, whereas overseas R&D
spending of U.S. firms remained below $20 billion (figure
O-7 ).
In S&E research output (as measured by publication in the world's
key journals), the number of U.S. articles stopped increasing after
the early 1990s. The U.S. share of world output has declined, indicative
of the development of cutting-edge research capabilities elsewhere
(figure O-8
).
Yet, U.S. researchers continue to make important contributions to
the world's S&T knowledge as evidenced by the high volume of
citations of their work by other researchers: articles by U.S. authors
are cited abroad more frequently than might be expected based on
their worldwide share of all articles. In many other countries'
S&T publications, references to U.S. articles are more numerous
than are references to the domestic literature (figure
O-9 ).
International scientific collaboration continues to expand as more
and more countries take part, and U.S.-based researchers are active
participants. Domestic and international collaborations are expanding
in response to the complexities of new scientific fields, the growing
scale and scope of scientific initiatives, new capabilities provided
by advances in information and communications technologies, professional
ties established during study or work abroad, and explicit government
policies and incentives.
In recent years, about 45 percent of the world's internationally
coauthored articles had at least one U.S.-based researcher among
their authors. Among coauthored articles published in the United
States in 2001, nearly one-fourth had at least one foreign coauthor,
up from 10 percent in the late 1980s (figure
O-10 ).
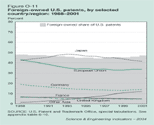
The volume of patents issued for inventions provides a broad measure
of technological change, and the number of U.S. patents has surged,
increasing from about 80,000 in 1988 to 166,000 in 2001. The large
and dynamic U.S. market is attractive to foreign inventors, who
have received between 44 and 48 percent of all U.S. patents since
the late 1980s. The volume and nature of these foreign-owned patents
provide insight into the relative technological competitiveness
of other countries and regions in the U.S. market. Japan, with the
largest share of foreign-owned U.S. patents, has seen that share
decline since the early 1990s. The EU's share fell from the late
1980s to the early 1990s, then stabilized at about 35 percent. The
share of selected Asian economies (China, South Korea, Singapore,
Taiwan, and Malaysia) rose steeply, from less than 2 to 12 percent,
which is indicative of their rapid technological progress (figure
O-11 ).
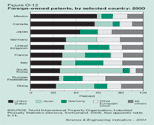
U.S. inventors also are well represented in the patent portfolios
of other nations. In most other countries, nonresident inventors
account for a larger share of patents than they do in the United
States. Among Western industrial countries, the foreign-owned share
ranges from 60 percent in Germany to 90 percent in Canada; however,
it is only 10 percent in Japan. In most countries, the United States
received more foreign patents than any other nation, followed by
Japan and Germany. In China and South Korea, Japanese inventors
led those from other countries (figure
O-12 ).
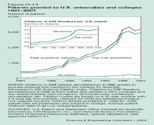
Many countries are trying to stimulate university-industry links
as a means of improving their innovation performance. Patents based
on research results have become a valued output of academic R&D.
In the United States, the number of patents awarded to academic
institutions has risen to more than 3,000 annually (figure
O-13 ).
This is more than 5 percent of all U.S. inventor patents, compared
with a share of about 1 percent 2 decades ago. During that period,
the incidence of citations to S&E literature in all U.S. patents
has risen to an average of about two citations per patent (figure
O-13 ).
The time lag between article publication and citation in patents
has grown quite short, and the cited articles often appear in basic
science journals, indicating an increasing tie between basic science
and practical application.
S&E Workforce
Trends
Many industrial countries have slow-growing or stagnating populations
with rising average ages, and their young citizens are not inclined
to enter S&E careers. Outflows of highly educated personnel
to other countries, especially to the United States, are a growing
focus of policy attention. Advanced developing nations are expanding
their higher education systems and the high-technology sectors of
their economies in an effort to develop internationally competitive
centers of excellence. In the past, these countries have been a
main source of internationally mobile scientific and technical talent,
but recently some of them have developed programs designed to retain
their highly trained personnel and to even attract people from abroad.
Because their more developed counterparts also face this issue,
these trends have set up the potential for growing competition in
the recruitment of foreign talent and for continuing international
mobility of firms to low-cost countries with well-trained workforces.
In the United States, the issue of expanding the domestic S&E
degree production is receiving increased attention.
Status of U.S. S&E Workforce
At the end of the past decade, about one-third of the 10.5 million
people with bachelor's or higher degrees in S&E were employed
in S&E occupations, holding job titles such as engineer; mathematician;
and physical, life, computer, or social scientist.
Others worked in jobs not classified as S&E, such as managerial,
marketing and sales, planning, and quality control positions. In
both types of jobs, their role is critical to the functioning of
a knowledge-based economy. They produce new knowledge; transform
it into innovative products, processes, and services; move these
innovations into the marketplace; and develop entirely new markets.
Even individuals who are not working in an S&E occupation in
the later stages of their careers generally regard the nature of
their S&E degree as related to their job (figure
O-14 ).
The long-term growth of the S&E labor force has been considerably
stronger than that of the civilian labor force as a whole, indicating
a trend toward growing technical sophistication (figure
O-1
and O-15
).
Since 1980, the number of S&E positions has risen at more than
four times the rate of growth for all jobs, reflecting the transformation
of the U.S. economy. Even if the creation of mathematician and computer
scientist jobs is omitted, growth in the remaining S&E occupations
still outpaced the growth of the civilian labor force as a whole.
The growth rate of U.S. S&E degree production has exceeded the
growth rate of the civilian labor force but lagged behind the growth
rate of S&E occupations, which is indicative of the key role
of foreign scientists and engineers in the U.S. S&E labor force.
In fact, the number of S&E doctorates earned by U.S. native-born
and naturalized citizens has grown more slowly than the growth rate
of the overall civilian labor force.
The U.S. Bureau of Labor Statistics (BLS) projects differential
growth that favors S&E occupations over the decade ranging from
2000 to 2010. Much of the projected difference is attributable to
expected strong growth in mathematics/ computer-related occupations.
Even without the addition of these jobs, the growth rate of S&E
jobs remains higher than the rate for the labor force as a whole,
but not by an order of magnitude. Because the BLS projection has
not been updated to reflect current difficulties in the information
technology (IT) sector, those growth estimates are likely to change.
An indication of the difficulties that the IT sector—and
S&E employment in general—faces can be gleaned from employment
and unemployment trends reflected in the BLS Current Population
Survey.
BLS figures show that employment in S&E occupations rose strongly
throughout the 1990s until 2001 (when it reached a record 5.6 million),
and then declined to 5.4 million in 2002. Unemployment rates for
S&E occupations, which traditionally have been lower than the
national average for the civilian labor force as a whole, rose strongly
in 2002. Breaking precedent, the unemployment rate for computer
programmers exceeded the national average in 2002, and the rate
for S&E technicians approached the average (figure
O-16 ).
Whether this signals a temporary or long-term slowdown in the IT
sector is unclear.
Retirements and Demographic Shifts
Unless current retirement rates change dramatically, the S&E
workforce in the United States will experience rapid growth in total
retirements over the next 2 decades. More than half of those with
S&E degrees are age 40 or older, and the 40–44 age group is
nearly four times as large as the 60–64 age group. Without changes
in degree production, retirement behavior, or immigration, these
figures imply that the U.S. S&E workforce will continue to grow,
but at a slower rate than before, and that its average age will
increase over the next 2 decades (figure
O-17 ).
These trends have placed attention on the needed replenishment of
the U.S. S&E workforce, with a focus on domestic degree production.
In recent decades, universities and colleges in the United States
have educated a growing share of the college-age population. In
1980, there were 22 bachelor's degrees awarded per 100 24-year-olds
(taken here as a proxy of the college-age population); by 2000 that
number had risen to 34. During that period, the S&E share of
all baccalaureate degrees fluctuated between 30 and 34 percent.
The share of natural science and engineering (NS&E) degrees
was more volatile, rising from 16 to 21 per 100 by the mid-1980s,
and then declining to the current 17 per 100. Over the past decade,
the number of bachelor's degrees in all fields rose by 18 percent,
and the numbers for S&E and NS&E degrees increased by 21
and 24 percent, respectively. Increases in S&E degrees reflect
strong growth in biological sciences, computer sciences, and psychology.
However, since 1990, bachelor's degrees in engineering have declined
by 8 percent and degrees in mathematics have dropped by about 20
percent (figure O-18
).
Demographic changes in the United States complicate the task of
increasing the number of S&E degrees relative to the relevant
age cohort. The proportion of non-Hispanic whites among 24-year-olds
has been on a steady multi-decade decline, falling from 74 percent
in 1985 to a projected 58 percent by 2020. This shift largely reflects
strong growth of population groups, especially Hispanics, that traditionally
have been underrepresented in S&E. Students from these population
groups earn associate's degrees more often than they earn bachelor's
degrees. In recent years, their overall attainment rate for bachelor's
degrees has been about half that of whites, and in NS&E, it
has been less than half that of whites (figure
O-19 ).
Complicating the picture, S&E attainment rates by white non-Hispanic
men have been on a long-term downturn that has been approximately
counterbalanced by the rising participation of women.
Even as larger proportions of U.S. citizens avail themselves of
higher education, the nation has lost the advantage it held for
several decades as the country offering by far the most widespread
access to higher education. Starting in the late 1970s and accelerating
in the 1990s, other countries built up their postsecondary education
systems, and a number of them now provide a first-level college
degree to at least one-third of their college-age cohort. There
is evidence that many countries are trying to increase production
of degrees in NS&E. They appear to be succeeding in that goal
well beyond what the United States has been able to achieve over
the past 25 years (figure
O-20 ).
Degree Trends
Over the past 2 decades, three prominent trends in S&E degrees
emerged. Among both U.S. citizens and noncitizens, women earned
larger numbers of degrees, whereas the number of degrees earned
by men rose more slowly or stagnated. Among U.S. citizens, underrepresented
minorities increased their share of degrees, chiefly during the
1990s. More foreigners earned U.S. S&E degrees, especially advanced
degrees, increasing both their total number and their share.
In 2000, women earned between 40 and 60 percent of bachelor's degrees
in mathematics; physical, earth, ocean, and atmospheric sciences;
and agricultural and biosciences. They also earned more than 75
percent of psychology degrees. Their share of engineering degrees
increased from 2 percent in the mid-1970s to 20 percent, but their
computer science share remained below one-third. The proportion
of bachelor's degrees earned by white students declined from 87
percent in 1977 to 68 percent in 2000. During the 1990s, the number
of degrees earned by white students decreased in all S&E fields
except computer sciences, biological and agricultural sciences,
and psychology.
The number of new S&E doctoral degrees rose strongly during
the 1980s, and that trend continued through 1998; it then declined
from its high of 28,800 to 27,100 in 2001. Among U.S. citizens,
the number of white non-Hispanic men earning Ph.D.s dropped from
about 9,400 in the early 1980s to 7,500 by 2001, whereas degrees
earned by white non-Hispanic women almost doubled and degrees earned
by minority groups approximately tripled. Growth in S&E doctorates
earned by temporary visa holders was strong during the 1980s, and
that number has fluctuated at around 8,000 since the early 1990s.
Their share of U.S. S&E doctorates rose from 17 to 33 percent
over the period, with even higher percentages in mathematics, computer
sciences, and engineering. The number of degrees earned by permanent
visa holders spiked during the 1990s (reflecting the conversion
to permanent visa status of Chinese students) but has since declined
to previous levels (figure
O-21 ).
Overall S&E master's degree trends mirror those for doctorates,
with the foreign-student component earning in excess of 25 percent
of degrees earned, more than double the rate in the late 1970s.
The United States attracts many scientists and engineers who come
here to work, and U.S. colleges and universities have trained many
scientists and engineers from other countries. From 1985 to 2001,
U.S. colleges and universities awarded about 150,000 S&E doctorates,
350,000 S&E master's degrees, and 270,000 S&E bachelor's
degrees to temporary visa students. Many of these younger scientists
and engineers stay on after completing their education, particularly
if they receive doctoral degrees, and they continue to contribute
to U.S. strength in R&D. Others go home or leave for other destinations,
but often maintain ties with U.S. colleagues that contribute to
collaborations across national boundaries (figure
O-22 ).
U.S. Reliance on Foreign Talent
The United States has benefited for decades from a steady inflow
of foreign scientists and engineers and continues to place greater
reliance than other countries on foreign-born talent. This reliance
has grown in both absolute numbers and relative share of foreign-born
individuals in the workforce, especially during the 1990s. Census-based
estimates of the proportion of foreign-born scientists and engineers
working in the United States in S&E occupations
in 1990 and in 2000 show steep increases at every degree level (figure
O-23 ).
These increases reflect both the immigration patterns of the 1990s
and the inflow of foreign specialists under various work visa categories.
The most recent figures, which are based on more complete data,
exceed earlier minimum estimates developed without data on the entry
of foreign-degreed nationals into U.S. S&E occupations from
1990 to 2000. These earlier (1999) estimates from the National Science
Foundation's Scientists and Engineers Statistical Data System indicated
11 percent of bachelor's degree holders in S&E occupations were
foreign born, compared with 17 percent according to the 2000 Census
data; 19 percent of master's degree holders, compared with 29 percent;
and 29 percent of doctorate holders, compared with 38 percent.
The share of foreign-born individuals varies according to their
occupation and degree level. In 2000, approximately half of all
doctorate holders among engineers; physical, life, and computer
scientists; and mathematicians were foreign born. Among computer
scientists and mathematicians, more than one-third of master's degree
holders and approximately one-fifth of bachelor's degree holders
were foreign born (figure
O-24 ).
Graduate education in the United States has long been attractive
to foreign students, and, over the years, their representation among
all S&E graduate students has approached 30 percent. Foreign
students with temporary visas represent half of all graduate enrollment
in engineering, mathematics, and computer sciences, and one-third
of enrollment in the physical, earth, ocean, and atmospheric sciences
combined (figure O-25
).
The share of foreign students is much lower among undergraduates,
as they earn approximately 4 percent of S&E bachelor's degrees;
this rate has generally been steady. However, foreign students do
earn approximately 8 percent of engineering and computer science
bachelor's degrees.
The terrorist attacks of September 2001 have added a security dimension
to ongoing discussions about the future of the U.S. S&E workforce,
which focus on how and with whom to fill new positions and existing
jobs vacated by retirement, especially in government or security-related
areas. Available data indicate an initial reaction to the new security
environment: the number of high-skill-related visas issued to students,
exchange visitors, and others in 2002 was significantly lower than
the number issued in 2001, and it continued to decline in 2003
(figure O-26
).
These data reflect both a drop in applications for all visa classes,
except exchange visitors, and higher U.S. Department of State visa
refusal rates (table O-1
 ). ).
Academic Employment
U.S. universities and colleges play a unique role in the U.S. R&D
system. They conduct about half of the nation's basic research and,
in so doing, train successive generations of scientists and engineers
for R&D and other types of positions in all sectors of the economy.
Like other sectors, academia is facing rising retirement rates among
its largely doctorate-level scientists and engineers. More than
30 percent of its faculty are 55 years of age or older, and the
total of individuals below age 45 has fallen to 36 percent (figure
O-27 ).
However, barring changes in degree production, retirement behavior,
or foreign participation, there appear to be sufficient numbers
of new doctorate holders to replace retiring incumbents and allow
for some growth.
Employment of foreign-born S&E doctorate holders in academia
shows a similar, but attenuated, pattern to that of industry. A
minimum estimate is that about 25–30 percent of S&E doctorate
holders employed in academia are foreign born; the rate is lower
among faculty and higher among postdocs. Among faculty members,
computer sciences, engineering, and mathematics have the highest
shares of foreign-born individuals, ranging from 28 to 38 percent.
Among postdocs, who play an important role in academic research,
these figures are significantly higher, reaching almost 70 percent
for engineering and 55–65 percent for most fields (figure
O-28 ).
Postdoc positions have long played an important part in the early
careers of physical and life scientists, and they have become more
prominent in other fields as well. These positions are intended
to provide further specialized training beyond the doctorate level,
and the number of these positions has more than doubled since the
mid-1970s, rising from about 22,000 to 47,000.
Almost all of them are in academia, but other sectors, chiefly industry,
account for 10–14 percent. At present, most individuals in postdoc
positions name reasons for accepting these positions that are consistent
with the objective of obtaining further specialized training. For
example, in 2001, only 12 percent stated that "other employment
[was] not available," a sharp drop from the 32 percent giving that
response in 1999.
An academic postdoc position is not necessarily a stepping stone
to an academic faculty position. Of individuals in postdoc positions
in April 1999, 37 percent were still in a postdoc position 2 years
later, 12 percent had obtained tenure-track faculty positions, 20
percent held other types of positions at educational institutions,
and 31 percent had found nonacademic employment.
The perception that most S&E doctorate holders work in academia
has been outdated for many years. Since the early 1980s, more than
half of all S&E doctorate holders have worked in industry, government,
nonprofit institutions, or elsewhere. That trend is most readily
apparent for young Ph.D.s in full-time positions.
Over the past 3 decades, growing numbers of these S&E Ph.D.s
have found employment outside academia as academia's share has declined
from 52 to 42 percent. Among individuals with academic appointments,
growing numbers are hired for nonfaculty and postdoc positions.
By 2001, only 63 percent held faculty positions, and only half were
in tenure-track jobs (figure
O-29 ).
Health of U.S.
High Technology
Indicators of the competitiveness of a nation's high-technology
sectors provide a good measure of the performance of its S&T
system. A nation's competitiveness may be judged by its ability
to produce goods and services that find demand both in the global
marketplace and at home while maintaining or improving its citizens'
standard of living. For high-wage nations like the United States,
high-technology industries and the S&E base on which they rest
are the means of remaining competitive in today's global market.
These industries create new markets; produce a large share of innovations
in goods, services, and processes; have high value-added production
and above-average compensation levels; and compete in international
markets. The results of their activities diffuse throughout the
economy, leading to increased productivity and business expansion.
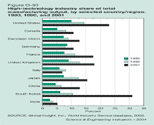
U.S. Performance in Knowledge-Intensive Industries
The U.S. economy continues to be the world's largest, ranking high
on all measures of high-technology competitiveness. The global market
for high-technology products has been growing faster than the market
for other manufactured goods, increasing by a real growth rate that
averages nearly 6.5 percent, compared with 2.4 percent for other
manufactured goods. High-technology industries are driving economic
growth around the world: their share of global manufacturing output
rose from approximately 8 to 16 percent over the past 2 decades
(figure O-30
).
Many other nations have advanced their technological capacity and
are challenging U.S. prominence in a variety of technology areas.
The U.S. share of the global high-technology market, measured as
the percentage of global industry shipments, declined from a high
of 33 percent in the early 1980s to below 30 percent in 1991; in
recent years, it has held steady in the 32–33 percent range. The
EU market share has gradually declined over the past 2 decades,
largely reflecting losses by Germany, the United Kingdom, and Italy;
only France gained share over the period. Declines by the EU and
Japan contrast with the strong rise of China and South Korea (figure
O-31 ).
The United States continues to hold the largest world market shares
in four of the five high-technology industry sectors, with U.S.
companies generally losing ground to competitors during the 1980s
and gaining it back during the 1990s. The only exception is in pharmaceuticals,
where the EU has held the lead position for the past 2 decades at
30–34 percent (figure O-32
).
In aerospace, the United States has accounted for about half of
all shipments since the late 1990s but has lost some ground to the
EU (30 percent in 2001). China showed strong growth in that sector,
increasing from less than 1 percent to nearly 7 percent in 2001,
whereas Brazil's share dropped sharply, falling to 3 percent from
15 percent 2 decades earlier. China registered strong gains in the
communications equipment and computers and office machinery industries;
South Korea also showed consistent growth in the latter area.
Exports reflect the success of an economy's products in international
markets. U.S. high-technology exports declined from 23 to 19 percent
of the world's total during the 1990s, but the United States continued
to produce a positive trade balance in high-technology goods. (The
United States ranked second behind the EU, which also lost export
market share, as did Japan.) In contrast, the remainder of the Asian
region has rapidly gained market share over the past 2 decades;
the combined high-technology exports of China, South Korea, Malaysia,
Singapore, and Taiwan rose from 8 percent in the early 1980s to
nearly 28 percent in 1999. The flattening of these countries' market
share in 2000 and 2001 reflects downturns in exports of communications
equipment and computers and office machinery (figure
O-33 ).
The decades-long growth in the importance of the U.S. service-sector
industries to the nation's economy has largely been driven by communications,
financial, business (including computer software development), education,
and health services. These knowledge-intensive industries incorporate
science, engineering, and technology in either their services or
the delivery of their services. The first three industries have
global markets; health services and education tend to be more local,
often largely provided by governments, and reflect population size
differences, thus making international share comparisons less meaningful.
Combined global sales of all five service industries rose in inflation-adjusted
terms from $5.4 trillion in 1980 to $8 trillion in 1990, and then
to $12.3 trillion in 2001 (figure
O-34 ).
The United States has been the leading provider of high technology
services, accounting for about one-third of the world total throughout
the past 2 decades. It held the largest market share in financial
services (40 percent), followed by the EU and Japan (26 and 10 percent,
respectively). It also led in communications services (38 percent
compared with the EU's 24 and Japan's 11 percent). The EU held the
largest market share in business services at 37 percent, followed
by the United States and Japan (34 and 15 percent, respectively).
Firms increasingly license or franchise proprietary technologies,
trademarks, and entertainment products across national boundaries,
generating royalties and licensing fees from these transactions.
The United States has traditionally shown a large and growing trade
surplus in these intellectual-property transactions, which include
cross-border payments between affiliated and unaffiliated companies.
However, since the mid-1990s, this surplus has been declining. Examining
only payments for use of intellectual property between unaffiliated
companies more accurately reflects the value of technical know-how
being traded. Here again the United States is a net exporter, with
overall receipts about three times as large as U.S. payments to
companies abroad (figure
O-35 ).
Around the world, the availability of venture capital financing
in the United States is viewed as key to the nation's rate of new
firm creation and overall economic vitality. U.S. venture capital
disbursements rose gradually from the early 1980s until 1994, reaching
a level of just over $4 billion. These disbursements then rose more
rapidly, reaching $22 billion by 1998 and soaring beyond $100 billion
in 2000 at the height of the dot.com boom. Disbursals in 2001–02
dropped back to 1998–99 levels, which are still high by historical
standards (figure O-36
).
During the 1990s, most funds were directed to companies engaged
in computer hardware and software production and related services
and to medical and health care firms. Internet-specific companies
became the leading recipients in 1999–2000, receiving more than
40 percent of the total, and they continued to receive more than
20 percent of the total in 2001–02. In the United States, the availability
of early-stage financing remains a concern because of a shrinking
share of total disbursed funds. Funds for proof-of- concept work
and early product development and initial marketing have fallen
to a historic low of 1.5 percent.
Conclusion
Many decades of investment in R&D have helped to lay the basis
for an S&E system that generates about one-third of the world's
research articles, a multitude of technological innovations, and
numerous high-technology industries that exploit innovations to
their profit and to the nation's economic benefit. The United States
has maintained its scientific and technological edge in the world
even as new centers of scientific and technical know-how and innovation
have emerged. It attracts many of the world's best scientists and
engineers, remains the world's leading producer of high-technology
products, and benefits from the rapid growth of knowledge-intensive
service industries. Its policies and practices are studied around
the world as models that might be applied by other countries in
their efforts to boost their competitive standing in a world that
is moving toward more knowledge-intensive industries.
Although the United States remains the world's S&T leader,
a collection of trends in indicators of U.S. S&T competitiveness
paints a more differentiated picture. In R&D performance, the
United States is slowly widening the gap with other leading nations
and regions such as the EU, non-U.S. G-7 countries, and non-U.S.
OECD nations. However, some non-OECD economies, including China,
the Russian Federation, and Taiwan, are slowly raising their spending
relative to that of OECD members. In S&E research output, as
measured by publications in the world's key journals, the U.S. share
continues to decline, indicative of the development of cutting-edge
research capabilities elsewhere. The overall U.S. world market share
in high-technology products is steady, but the nation's aerospace
industry is losing market share. Although the U.S. balance in intellectual
products trade remains positive, it is showing signs of a gradual
decline.
A range of indicators traces a trend that shows growing competitive
strength in the Asian region outside of Japan, chiefly in China,
South Korea, Malaysia, Singapore, and Taiwan. Scientists based in
those countries produce a growing share of the S&T articles
appearing in the world's leading journals, and development of regional
scientific collaboration (centered on China) is apparent. These
Asian economies have an expanding world market share of high-technology
production. In exports of high-technology products, they are gaining
market share on all major industrial nations including the United
States. They are increasing their production of S&E degrees
with a special focus on NS&E, thus providing a growing stream
of new technical talent for their economies. They have in place,
or are instituting, policies and incentives to retain their highly
trained personnel, attract expatriates, or otherwise benefit from
their nationals working abroad, chiefly in the United States.
As nations have turned to the task of developing a broader base
of knowledge-intensive industries, they face the necessity of rethinking
their workforce needs. Many are further expanding their education
systems, placing emphasis on S&T training. Japan and the mature
industrial nations of Europe, which have aging and declining or
stagnating populations, are seeking an inflow of scientists and
engineers from abroad as well as the return of their own researchers
from other countries. All of these nations face declining interest
in S&E among their young people, and all emphasize the importance
of attracting more women to S&E careers. Increasingly, these
nations seek to attract foreign students: there is growing interest
in what makes the United States attractive to people from around
the world as a place to study and work.
The United States faces somewhat different issues connected with
the development of the S&T workforce. Like the other industrialized
nations, the United States faces a period of growing retirements
among its S&E workforce. Unlike them, it has a growing population
whose average age is projected to decline rather than increase.
Its college-age population will increasingly be made up of minority
group members, such as Hispanics, blacks, and American Indian/ Alaskan
Natives, whose current participation rates in S&E are half or
less those of white non-Hispanic students. As lower proportions
of white non-Hispanic men obtain S&E degrees, the importance
of women and minorities pursuing degrees in these fields rises.
Over the past 2 decades, the U.S. S&E workforce has grown at
more than four times the rate of total employment, in part because
of the U.S. ability to integrate large numbers of foreign-born scientists
and engineers into its workforce. Nevertheless, barring changes
in current retirement, degree production, and immigration trends,
the growth of the S&E workforce will slow down, leading to a
rising average age.
Information about some key indicators is missing. This scenario
does not include the potential effects on foreign scientists' longer
term willingness to work or study in the United States caused by
the nation's reaction to the attacks of September 2001. It does
not reflect restrictions the U.S. government might place on foreign
scientists' access to the United States. Most important, it does
not include indicators on U.S.- and foreign-based firms' inclination
to locate operations overseas in pursuit of new markets, well-trained
talent, and lower costs.

|