Geology Potpourri
These animations were originally produced for US Geological Survey videos. They have been converted to animated gifs for web display. You may use these animations for any educational purpose, we simply request that you cite the US Geological Survey as their source.
Note: these are whopping big files! Smaller versions and descriptive information will be added as soon as possible!
Click here to go to the plate tectonics animation page.
Click here to go to the oil and gas animation page.
|

|

GEOMAP_3.MPG - Click on image to see animation (2.6 MB)
This animation shows a colored shaded-relief map of the US, then overlays a geologic map of the US for comparison.
|

LIGHTS_3.MPG - Click on image to see animation (1.3 MB)
Where are the world’s energy-using urban areas? You can easily see them on this spinning globe shown at night.
|

GRNHOU_3.MPG - Click on image to see animation (6.9 MB)
Greenhouse effect.
|

ATGAS_3.MPG - Click on image to see animation (4.9 MB)
Begins by showing greenhouse effect, then ties this into increasing concentrations of atmospheric methane.
|

COSMIC_3.MPG - Click on image to see animation (2.9 MB)
Comets fly by, planet forms
|
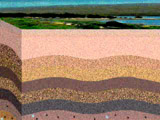
PETSYS_3.MPG - Click on image to see animation (9.1 MB)
Begins with oceans depositing layer upon layer of sediment. Layers gradually compact, then fold, then fault. Oil migrates into traps created by the folds from layers below.
|

POROS_3.MPG - Click on image to see animation (6.1 MB)
Porosity and vein formation.
|

SISHIP_3.MPG - Click on image to see animation (6.4 MB)
Shows ship collecting seismic reflection information from sea floor. Seismic profile is generated that is used to make a cross section of rock layers and oil hidden beneath the subsurface. Oil rigs drill and remove hydrocarbons.
|