Metrics 2.0: who will be the ‘Google of altmetrics’?
14 Jun, 13 | by Claire Bower, Digital Comms Manager, @clairebower
At last week’s SSP conference in San Francisco, those of us interested in Altmetrics were rather excited to see representatives from each of the major products come together in a session entitled ‘Metrics 2.0: It’s about Time…..and People’.
First up was Andrea Michalek of Plum Analytics (who kindly shared her slides here). She revealed a sneak preview of work being done with the The Smithsonian, one of Plum’s first customers. Their product, PlumX, is being used to collect data (usage, captures, mentions, social media, citations) in order to generate reports on publication activity in support of research evaluation.
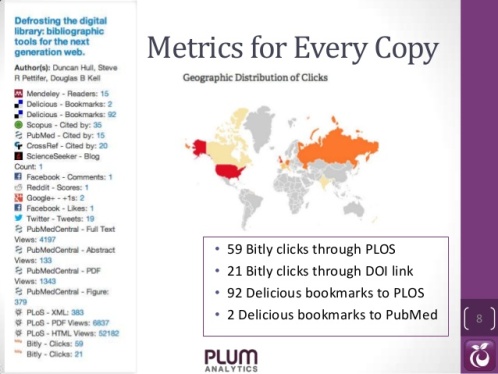
She explained how in scholarly communications, the same article can be published in multiple locations on the web (e.g. publisher website, PubMed Central, Mendeley). Fortunately, Plum collects and displays the counts from each of these individual locations, allowing users to get a full view of the engagement surrounding a particular article, video, presentation etc. Indeed, she stressed the importance of tracking the impact of all aspects of output, not just the article. She spoke of these ‘2nd level metrics’ and used the example of an author who blogs about his/her research.
Next to speak was Euan Adie of Altmetric.com. He described his product as being more focused on publishers than researchers, which differentiates it from the other altmetric providers on the panel. He stressed that altmetrics are not identifiers of quality, the same way that citations are not. He went on to explain that articles that received the most online attention may well attract the ‘wrong’ audience and often contain populist terms like sex, coffee or cannabis in their title (more on this on the Altmetric.com blog).
Euan also presented a new feature that has been introduced around mentions in policy documents; clear indicators of impact that are not picked up by citations. While papers usually have 50% of the tweets they will ever receive in the first three days after publication, this is not so with policy documents. He presented an interesting example and asked where the evidence for the UK’s diabetes type 2 treatment guidelines comes from? Whilst the Lancet received 11% of the citations and the BMJ 9%, smaller journals also had an impact, such as CRMO, which received 2.6% (25 citations). Tracking this new metric will help us to surface the impact that smaller journals are having.
Jason Priem differentiated ImpactStory from the others by stressing that it was a non-profit organisation. Also, rather than focusing on traditional outputs, ImpactStory is interested in identifying alternative ways to measure and understand the new ecosystem of the Web. Just as the printing press transformed publishing, so too will the Web (to a larger degree than it has already). He explained that the Web is so powerful because there’s one bucket that contains everything. The future of altmetrics should be the same and there needs to be an open infrastructure that can be built on top of (more on this later).
He raised an interesting issue about inconsistent results between different altmetric tracking systems. Why would a paper have different scores on altmetric.com and ImpactStory? Whilst he didn’t exactly answer the question, he did point to the fact that citation tracking services can also be wildly inconsistent, without causing too much inconvenience to researchers.
He showed an interesting example of how ImpactStory was being used. The UK Parkinson’s Disease Consortium at UCL have integrated ImpactStory into their publications page in order to show the impact of their output. This is especially important as they are trying to gain funding for further research.

Martin Fenner of PLOS was the final speaker. He reiterated that whilst there was a good deal of overlap between the various altmetric providers, there are significant differences (PLOS’ being that it is a publisher rather than a third party service). He ran through the various aspects of the PLOS article-level metric reports, including the ability to aggregate up statistics from specific sets of articles. He stressed the importance of visualising data and showed an impressive 4D bubble chart showing total views, months, scopus ctitations and journal name.
Q&A
I’ve tried to capture some of the key points from the lively Q&A session that followed the main presentations:
- Although tweets may contain negative rather positive sentiment, altmetrics looks at a correlation of data points rather than just one metric. Also, it can sometimes be useful to see the negative impact.
- Authors really like to track their impact. However, this is not just vanity – they want feedback on their work.
- Researchers who have prospered in the traditional system of citations tend to be less enthusiastic about alternative metrics. Fans are often younger and more experimental users.
- Funders, such as the National Institutes of Health, are also enthusiasts as they need to show the value of the money they are spending.
- In terms of historical data, it’s very difficult to go back beyond a certain point. Twitter doesn’t even store data for more than 2 years. Altmetric.com goes back the furthest (to July 2011).
Towards the end of the session, a representative from Emerald Group Publishing asked whether we will we need an aggregator to bring together all of the statistics provided by the (slightly confusing) array of altmetric services. Jason Priem’s response to this was really insightful. He expressed the desire for another party to build a ‘Google of altmetrics’ on top of all altmetric providers. He doesn’t see ImpactStory as being the end solution, more part of the infrastructure. It will certainly be interesting to see who and when somebody will step up to this challenge!

Pingback: Metrics 2.0: who will be the ‘Google of altmetrics’? | csid
Pingback: Metrics 2.0: who will be the ‘Google of a...
Pingback: Twitter Open Access Report – 17 Jun 2013 |