Econometrics
| Economics |
|---|

|
|
|
| By application |
|
| Lists |
Econometrics is the application of mathematics, statistical methods, and, more recently, computer science, to economic data and is described as the branch of economics that aims to give empirical content to economic relations.[1] More precisely, it is "the quantitative analysis of actual economic phenomena based on the concurrent development of theory and observation, related by appropriate methods of inference."[2] An introductory economics textbook describes econometrics as allowing economists "to sift through mountains of data to extract simple relationships."[3] The first known use of the term "econometrics" (in cognate form) was by Polish economist Paweł Ciompa in 1910.[4] Ragnar Frisch is credited with coining the term in the sense in which it is used today.[5]
Econometrics is the intersection of economics, mathematics, and statistics. Econometrics adds empirical content to economic theory allowing theories to be tested and used for forecasting and policy evaluation.[6]
Contents
Basic econometric models: linear regression[edit]
The basic tool for econometrics is the linear regression model. In modern econometrics, other statistical tools are frequently used, but linear regression is still the most frequently used starting point for an analysis.[7] Estimating a linear regression on two variables can be visualized as fitting a line through data points representing paired values of the independent and dependent variables.

For example, consider Okun's law, which relates GDP growth to the unemployment rate. This relationship is represented in a linear regression where the change in unemployment rate ( ) is a function of an intercept (
 ), a given value of GDP growth multiplied by a slope coefficient
  and an error term,
  :
:

The unknown parameters and can be estimated. Here is estimated to be −1.77 and is estimated to be 0.83. This means that if GDP growth increased by one percentage point, the unemployment rate would be predicted to drop by .94 points (−1.77*1+0.83). The model could then be tested for statistical significance as to whether an increase in growth is associated with a decrease in the unemployment, as hypothesized. If the estimate of were not significantly different from 0, the test would fail to find evidence that changes in the growth rate and unemployment rate were related.
Theory[edit]
Econometric theory uses statistical theory to evaluate and develop econometric methods. Econometricians try to find estimators that have desirable statistical properties including unbiasedness, efficiency, and consistency. An estimator is unbiased if its expected value is the true value of the parameter; It is consistent if it converges to the true value as sample size gets larger, and it is efficient if the estimator has lower standard error than other unbiased estimators for a given sample size. Ordinary least squares (OLS) is often used for estimation since it provides the BLUE or "best linear unbiased estimator" (where "best" means most efficient, unbiased estimator) given the Gauss-Markov assumptions. When these assumptions are violated or other statistical properties are desired, other estimation techniques such as maximum likelihood estimation, generalized method of moments, or generalized least squares are used. Estimators that incorporate prior beliefs are advocated by those who favor Bayesian statistics over traditional, classical or "frequentist" approaches.
Methods[edit]
Applied econometrics uses theoretical econometrics and real-world data for assessing economic theories, developing econometric models, analyzing economic history, and forecasting.[8]
Econometrics may use standard statistical models to study economic questions, but most often they are with observational data, rather than in controlled experiments.[9] In this, the design of observational studies in econometrics is similar to the design of studies in other observational disciplines, such as astronomy, epidemiology, sociology and political science. Analysis of data from an observational study is guided by the study protocol, although exploratory data analysis may by useful for generating new hypotheses.[10] Economics often analyzes systems of equations and inequalities, such as supply and demand hypothesized to be in equilibrium. Consequently, the field of econometrics has developed methods for identification and estimation of simultaneous-equation models. These methods are analogous to methods used in other areas of science, such as the field of system identification in systems analysis and control theory. Such methods may allow researchers to estimate models and investigate their empirical consequences, without directly manipulating the system.
One of the fundamental statistical methods used by econometricians is regression analysis.[11] Regression methods are important in econometrics because economists typically cannot use controlled experiments. Econometricians often seek illuminating natural experiments in the absence of evidence from controlled experiments. Observational data may be subject to omitted-variable bias and a list of other problems that must be addressed using causal analysis of simultaneous-equation models.[12]
Artificial intelligence methods[edit]
Artificial Intelligence has become important for building econometric models and for use in decision making.[13] Artificial intelligence is a nature-inspired computational paradigm which has found usage in many areas. It allows economic models to be of arbitrary complexity and also to be able to evolve as the economic environment also changes. For example, artificial intelligence has been applied to simulate the stock market, to model options and derivatives as well as model and control interest rates.
Experimental economics[edit]
In recent decades, econometricians have increasingly turned to use of experiments to evaluate the often-contradictory conclusions of observational studies. Here, controlled and randomized experiments provide statistical inferences that may yield better empirical performance than do purely observational studies.[14]
Data[edit]
Data sets to which econometric analyses are applied can be classified as time-series data, cross-sectional data, panel data, and multidimensional panel data. Time-series data sets contain observations over time; for example, inflation over the course of several years. Cross-sectional data sets contain observations at a single point in time; for example, many individuals' incomes in a given year. Panel data sets contain both time-series and cross-sectional observations. Multi-dimensional panel data sets contain observations across time, cross-sectionally, and across some third dimension. For example, the Survey of Professional Forecasters contains forecasts for many forecasters (cross-sectional observations), at many points in time (time series observations), and at multiple forecast horizons (a third dimension).
Instrumental variables[edit]
In many econometric contexts, the commonly-used ordinary least squares method may not recover the theoretical relation desired or may produce estimates with poor statistical properties, because the assumptions for valid use of the method are violated. One widely used remedy is the method of instrumental variables (IV). For an economic model described by more than one equation, simultaneous-equation methods may be used to remedy similar problems, including two IV variants, Two-Stage Least Squares (2SLS), and Three-Stage Least Squares (3SLS).[15]
Computational methods[edit]
Computational concerns are important for evaluating econometric methods and for use in decision making.[16] Such concerns include mathematical well-posedness: the existence, uniqueness, and stability of any solutions to econometric equations. Another concern is the numerical efficiency and accuracy of software.[17] A third concern is also the usability of econometric software.[18]
Structural econometrics[edit]
Structural econometrics extends the ability of researchers to analyze data by using economic models as the lens through which to view the data. The benefit of this approach is that any policy recommendations are not subject to the Lucas critique since counter-factual analyses take an agent's re-optimization into account. Structural econometric analyses begin with an economic model that captures the salient features of the agents under investigation. The researcher then searches for parameters of the model that match the outputs of the model to the data. There are two ways of doing this. The first requires the researcher to completely solve the model and then use maximum likelihood.[19] However, there have been many advances that can bypass the full solution of the model and that estimate models in two stages. Importantly, these methods allow the researcher to consider more complicated models with strategic interactions and multiple equilibria.[20]
A good example of structural econometrics is in the estimation of first price sealed bid auctions with independent private values.[21] The key difficulty with bidding data from these auctions is that bids only partially reveal information on the underlying valuations, bids shade the underlying valuations. One would like to estimate these valuations in order to understand the magnitude of profits each bidder makes. More importantly, it is necessary to have the valuation distribution in hand to engage in mechanism design. In a first price sealed bid auction the expected payoff of a bidder is given by:

where v is the bidder valuation, b is the bid. The optimal bid  solves a first order condition:

which can be re-arranged to yield the following equation for 
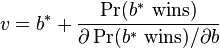
Notice that the probability that a bid wins an auction can be estimated from a data set of completed auctions, where all bids are observed. This can be done using simple non-parametric estimators. If all bids are observed, it is then possible to use the above relation and the estimated probability function and its derivative to point wise estimate the underlying valuation. This will then allow the investigator to estimate the valuation distribution.
Example[edit]
A simple example of a relationship in econometrics from the field of labor economics is:

This example assumes that the natural logarithm of a person's wage is a linear function of the number of years of education that person has acquired. The parameter measures the increase in the natural log of the wage attributable to one more year of education. The term  is a random variable representing all other factors that may have direct influence on wage. The econometric goal is to estimate the parameters,
  under specific assumptions about the random variable . For example, if is uncorrelated with years of education, then the equation can be estimated with ordinary least squares.
If the researcher could randomly assign people to different levels of education, the data set thus generated would allow estimation of the effect of changes in years of education on wages. In reality, those experiments cannot be conducted. Instead, the econometrician observes the years of education of and the wages paid to people who differ along many dimensions. Given this kind of data, the estimated coefficient on Years of Education in the equation above reflects both the effect of education on wages and the effect of other variables on wages, if those other variables were correlated with education. For example, people born in certain places may have higher wages and higher levels of education. Unless the econometrician controls for place of birth in the above equation, the effect of birthplace on wages may be falsely attributed to the effect of education on wages.
The most obvious way to control for birthplace is to include a measure of the effect of birthplace in the equation above. Exclusion of birthplace, together with the assumption that is uncorrelated with education produces a misspecified model. Another technique is to include in the equation additional set of measured covariates which are not instrumental variables, yet render identifiable.[22] An overview of econometric methods used to study this problem were provided by Card (1999).[23]
Journals[edit]
The main journals which publish work in econometrics are Econometrica, the Journal of Econometrics, the Review of Economics and Statistics, Econometric Theory, the Journal of Applied Econometrics, Econometric Reviews, the Econometrics Journal,[24] Applied Econometrics and International Development, the Journal of Business & Economic Statistics, and the Journal of Economic and Social Measurement.
Limitations and criticisms[edit]
Like other forms of statistical analysis, badly specified econometric models may show a spurious correlation where two variables are correlated but causally unrelated. In a study of the use of econometrics in major economics journals, McCloskey concluded that economists report p values (following the Fisherian tradition of tests of significance of point null-hypotheses), neglecting concerns of type II errors; economists fail to report estimates of the size of effects (apart from statistical significance) and to discuss their economic importance. Economists also fail to use economic reasoning for model selection, especially for deciding which variables to include in a regression.[25][26]
In some cases, economic variables cannot be experimentally manipulated as treatments randomly assigned to subjects.[27] In such cases, economists rely on observational studies, often using data sets with many strongly associated covariates, resulting in enormous numbers of models with similar explanatory ability but different covariates and regression estimates. Regarding the plurality of models compatible with observational data-sets, Edward Leamer urged that "professionals ... properly withhold belief until an inference can be shown to be adequately insensitive to the choice of assumptions".[28]
Economists from the Austrian School argue that aggregate economic models are not well suited to describe economic reality because they waste a large part of specific knowledge. Friedrich Hayek in his The Use of Knowledge in Society argued that "knowledge of the particular circumstances of time and place" is not easily aggregated and is often ignored by professional economists.[29][30]
Notable econometricians[edit]
- Joshua Angrist
- Sir James Ball
- Alok Bhargava
- Edwin 'Sedge' Coppock
- James Durbin
- Robert F. Engle (Nobel Prize in 2003)[31]
- Ragnar Frisch (Nobel Prize in 1969) [31]
- Wayne Fuller
- Clive Granger (Nobel Prize in 2003) [31]
- William Greene
- Trygve Haavelmo (Nobel Prize in 1989) [31]
- James D. Hamilton
- Lars Peter Hansen (Nobel Prize in 2013) [31]
- Jerry Hausman
- Fumio Hayashi
- David Forbes Hendry
- James Heckman (Nobel Prize in 2000) [31]
- Guido Imbens
- Lawrence Klein (Nobel Prize in 1980) [31]
- CEV Leser
- Daniel McFadden (Nobel Prize in 2000)
- Peter C. B. Phillips
- Peter M. Robinson
- Denis Sargan
- Halbert White
- Jeffrey Wooldridge
See also[edit]
| Wikimedia Commons has media related to Econometrics. |
- Augmented Dickey–Fuller test
- Choice modelling
- Cowles Foundation
- Econometric software
- Financial modeling
- Granger causality
- Important publications in econometrics
- Macroeconomic model
- Methodological individualism
- Predetermined variables
- Single equation methods (econometrics)
- Spatial econometrics
- Unit root
Notes[edit]
- ^ M. Hashem Pesaran (1987). "Econometrics," The New Palgrave: A Dictionary of Economics, v. 2, p. 8 [pp. 8-22]. Reprinted in J. Eatwell et al., eds. (1990). Econometrics: The New Palgrave, p. 1 [pp. 1-34]. Abstract (2008 revision by J. Geweke, J. Horowitz, and H. P. Pesaran).
- ^ P. A. Samuelson, T. C. Koopmans, and J. R. N. Stone (1954). "Report of the Evaluative Committee for Econometrica," Econometrica 22(2), p. 142. [p p. 141-146], as described and cited in Pesaran (1987) above.
- ^ Paul A. Samuelson and William D. Nordhaus, 2004. Economics. 18th ed., McGraw-Hill, p. 5.
- ^ http://www.dziejekrakowa.pl/biogramy/index.php?id=516
- ^ • H. P. Pesaran (1990), "Econometrics," Econometrics: The New Palgrave, p. 2, citing Ragnar Frisch (1936), "A Note on the Term 'Econometrics'," Econometrica, 4(1), p. 95.
• Aris Spanos (2008), "statistics and economics," The New Palgrave Dictionary of Economics, 2nd Edition. Abstract. - ^ Geweke, Horowitz & Pesaran 2008.
- ^ Greene (2012), 12.
- ^ Clive Granger (2008). "forecasting," The New Palgrave Dictionary of Economics, 2nd Edition. Abstract.
- ^ Wooldridge, Jeffrey (2013). Introductory Econometrics, A modern approach. South-Western, Cengage learning. ISBN 978-1-111-53104-1.
- ^ Herman O. Wold (1969). "Econometrics as Pioneering in Nonexperimental Model Building," Econometrica, 37(3), pp. 369-381.
- ^ For an overview of a linear implementation of this framework, see linear regression.
- ^ Edward E. Leamer (2008). "specification problems in econometrics," The New Palgrave Dictionary of Economics. Abstract.
- ^ • Tshilidzi Marwala (2013). "Economic Modeling Using Artificial Intelligence Methods." Springer-Verlag,
- ^ • H. Wold 1954. "Causality and Econometrics," Econometrica, 22(2), p p. 162-177.
• Kevin D. Hoover (2008). "causality in economics and econometrics," The New Palgrave Dictionary of Economics, 2nd Edition. Abstract and galley proof. - ^ Peter Kennedy (economist) (2003). A Guide to Econometrics, 5th ed. Description, preview, and TOC, ch. 9, 10, 13, and 18.
- ^ • Keisuke Hirano (2008). "decision theory in econometrics," The New Palgrave Dictionary of Economics, 2nd Edition. Abstract.
• James O. Berger (2008). "statistical decision theory," The New Palgrave Dictionary of Economics, 2nd Edition. Abstract. - ^ B. D. McCullough and H. D. Vinod (1999). "The Numerical Reliability of Econometric Software," Journal of Economic Literature, 37(2), pp. 633-665.
- ^ • Vassilis A. Hajivassiliou (2008). "computational methods in econometrics," The New Palgrave Dictionary of Economics, 2nd Edition. Abstract.
• Richard E. Quandt (1983). "Computational Problems and Methods," ch. 12, in Handbook of Econometrics, v. 1, pp. 699-764.
• Ray C. Fair (1996). "Computational Methods for Macroeconometric Models," Handbook of Computational Economics, v. 1, pp. [1]-169. - ^ Rust, John (1987). "Optimal Replacement of GMC Bus Engines: An Empirical Model of Harold Zurcher". Econometrica 55 (5): 999–1033. JSTOR 1911259.
- ^ Hotz, V. Joseph; Miller, Robert A. (1993). "Conditional Choice Probabilities and the Estimation of Dynamic Models". Review of Economic Studies 60 (3): 497–529. JSTOR 2298122.
- ^ Guerre, E.; Perrigne, I.; Vuong, Q. (2000). "Optimal Nonparametric Estimation of First Price Auctions". Econometrica 68 (3): 525–574. doi:10.1111/1468-0262.00123.
- ^ Pearl, Judea (2000). Causality: Model, Reasoning, and Inference. Cambridge University Press. ISBN 0521773628.
- ^ Card, David (1999). "The Causal Effect of Education on Earning". In Ashenfelter, O.; Card, D. Handbook of Labor Economics. Amsterdam: Elsevier. pp. 1801–1863. ISBN 0444822895.
- ^ "The Econometrics Journal - Wiley Online Library". Wiley.com. Retrieved 2013-10-08.
- ^ McCloskey (May 1985). "The Loss Function has been mislaid: the Rhetoric of Significance Tests". American Economic Review 75 (2).
- ^ Stephen T. Ziliak and Deirdre N. McCloskey (2004). "Size Matters: The Standard Error of Regressions in the American Economic Review," Journal of Socio-economics, 33(5), pp. 527-46 (press +).
- ^ Leamer, Edward (March 1983). "Let's Take the Con out of Econometrics". American Economic Review 73 (1): 34.
- ^ Leamer, Edward (March 1983). "Let's Take the Con out of Econometrics". American Economic Review 73 (1): 43.
- ^ Robert F. Garnett. What Do Economists Know? New Economics of Knowledge. Routledge, 1999. ISBN 978-0-415-15260-0. p. 170
- ^ G. M. P. Swann. Putting Econometrics in Its Place: A New Direction in Applied Economics. Edward Elgar Publishing, 2008. ISBN 978-1-84720-776-0. p. 62-64
- ^ a b c d e f g "Nobel Prize Economic Sciences". nobelprize.org. Retrieved 2014-09-09.
References[edit]
- Handbook of Econometrics Elsevier. Links to volume chapter-preview links:
Zvi Griliches and Michael D. Intriligator, ed. (1983). v. 1; (1984),v. 2; (1986), description, v. 3; (1994), description, v. 4
Robert F. Engle and Daniel L. McFadden, ed. (2001).Description, v. 5
James J. Heckman and Edward E. Leamer, ed. (2007). Description, v. 6A & v. 6B - Handbook of Statistics, v. 11, Econometrics (1993), Elsevier. Links to first-page chapter previews.
- International Encyclopedia of the Social & Behavioral Sciences (2001), Statistics, "Econometrics and Time Series," links to first-page previews of 21 articles.
- Angrist, Joshua & Pischke, Jörn‐Steffen (2010). "The Credibility Revolution in Empirical Economics: How Better Research Design Is Taking the Con out of Econometrics], 24(2), , pp. 3–30. Abstract.
- Eatwell, John, et al., eds. (1990). Econometrics: The New Palgrave. Article-preview links (from The New Palgrave: A Dictionary of Economics, 1987).
- Geweke, John; Horowitz, Joel; Pesaran, Hashem (2008). "Econometrics". In Durlauf, Steven N.; Blume, Lawrence E. The New Palgrave Dictionary of Economics (Palgrave Macmillan). doi:10.1057/9780230226203.0425.
- Greene, William H. (1999, 4th ed.) Econometric Analysis, Prentice Hall.
- Hayashi, Fumio. (2000) Econometrics, Princeton University Press. ISBN 0-691-01018-8 Description and contents links.
- Hamilton, James D. (1994) Time Series Analysis, Princeton University Press. Description and preview.
- Hughes Hallett, Andrew J. "Econometrics and the Theory of Economic Policy: The Tinbergen-Theil Contributions 40 Years On," Oxford Economic Papers (1989) 41#1 pp 189–214
- Kelejian, Harry H., and Wallace E. Oates (1989, 3rd ed.) Introduction to Econometrics.
- Kennedy, Peter (2003). A guide to econometrics. Cambridge, Mass: MIT Press. ISBN 978-0-262-61183-1.
- Russell Davidson and James G. MacKinnon (2004). Econometric Theory and Methods. New York: Oxford University Press. Description.
- Mills, Terence C., and Kerry Patterson, ed. Palgrave Handbook of Econometrics:
- (2007) v. 1: Econometric Theoryv. 1. Links to description and contents.
- (2009) v. 2, Applied Econometrics. Palgrave Macmillan. ISBN 978-1-4039-1799-7 Links to description and contents.
- Pearl, Judea (2009, 2nd ed.). Causality: Models, Reasoning and Inference, Cambridge University Press, Description, TOC, and preview, ch. 1-10 and ch. 11. 5 economics-journal reviews, including Kevin D. Hoover, Economics Journal.
- Pindyck, Robert S., and Daniel L. Rubinfeld (1998, 4th ed.). Econometric Methods and Economic Forecasts, McGraw-Hill.
- Santos Silva, J.M.C. and Tenreyro, Silvana (2006), “The Log of Gravity,” The Review of Economics and Statistics, 88(4), pp. 641–658. <http://www.mitpressjournals.org/doi/pdfplus/10.1162/rest.88.4.641>
- Studenmund, A.H. (2011, 6th ed.). Using Econometrics: A Practical Guide. Contents (chapter-preview) links.
- Wooldridge, Jeffrey (2003). Introductory Econometrics: A Modern Approach. Mason: Thomson South-Western. ISBN 0-324-11364-1 Chapter-preview links in brief and detail.
Further reading[edit]
- Econometric Theory book on Wikibooks
- Giovannini, Enrico Understanding Economic Statistics, OECD Publishing, 2008, ISBN 978-92-64-03312-2
External links[edit]
| Wikimedia Commons has media related to Econometrics. |
| Look up econometrics in Wiktionary, the free dictionary. |
- Journal of Financial Econometrics
- Econometric Society
- The Econometrics Journal
- Econometric Links
- Teaching Econometrics (Index by the Economics Network (UK))
- Applied Econometric Association
- The Society for Financial Econometrics
- The interview with Clive Granger - Nobel winner in 2003, about econometrics