

Images & Animations
-
Credit
NASA/Goddard Space Flight Center Scientific Visualization Studio
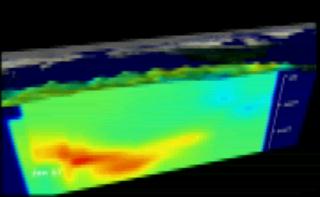
El Nino Zoom to Cross-section of Temperature and Height Anomalies: January 1997 through March 1998.
Views of sea surface height (represented by the bumps) and sea temperature (represented by the color). Red is 10 degrees C above normal, blue is 10 degrees C below normal. Notice the large area of colder than normal water shutting off El Nino towards the end of the animation.
Metadata
-
Sensor
TOPEX/Poseidon, TDRSS/TRITON Array -
Animation ID
2628 -
Video ID
None -
Start Timecode
00:00:00:00 -
End Timecode
00:00:00:00 -
Animator
Greg Shirah -
Studio
SVS -
Visualization Date
1998/10/17 -
Scientist
Antonio Busalacchi (NASA/GSFC) -
Datasets
Sea Surface Temperature Anomaly, Sea Surface Height Anomaly, Sea Temperature Anomaly -
Keywords
El Nino, Sea Surface Height, Sea Temperature -
DLESE Subject
Physical oceanography -
Data Date
1/1/97 to 3/10/98 -
Animation Type
Regular