+ Visit NASA.gov
+ Advanced Search
+ About the Server
+ Animation List
+ How to Use the Server
+ RSS Feeds
+ Podcasts
+ Opportunities
Most Recently Released Print Images Produced by the SVS as of 2009-08-22
[View the 100 Most Recently Released Animations Produced by the SVS]
Completed:
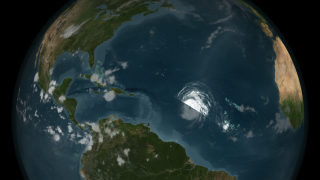
2009-08-18
ID Number:
3626
hurricaneBill08182009_30fps.m4v
a003626.mp4
frames/1280x720_16x9_30p/
frames/1280x720_16x9_60p/
HurricaneBill08182009.mp4
hurricaneBill08182009.m4v
bill08182009_print.0153.tif
bill08182009_print.0153_web.png
bill08182009_print.0153_gal.png
bill08182009_print.0153_thm.png
Completed:
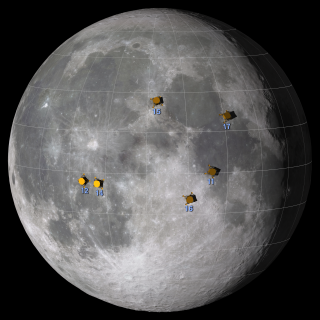
2009-07-16
ID Number:
3620
lroc_apollo_print1.tif
lroc_apollo_print1_web.png
Completed:
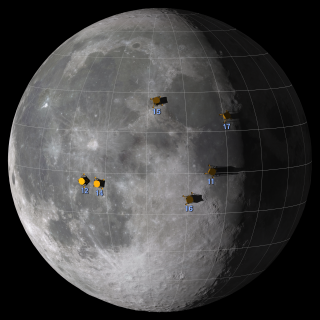
2009-07-16
ID Number:
3620
lroc_apollo_print2.tif
lroc_apollo_print2_web.png
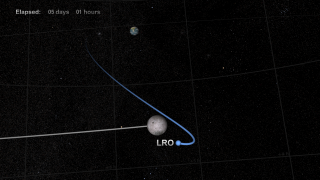
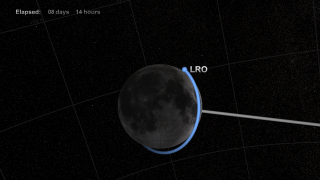
Completed:
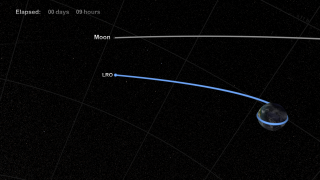
2009-04-27
ID Number:
3612
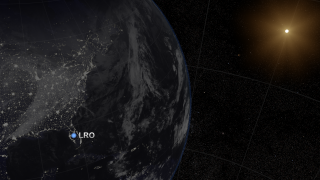
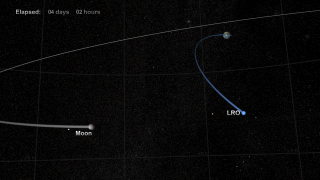
lro_orbit_still.0001.tif
lro_orbit_still.0001_web.png
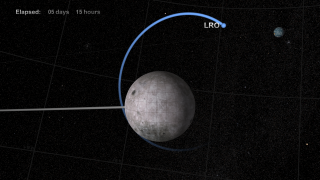
Completed:
2009-04-27
ID Number:
3612
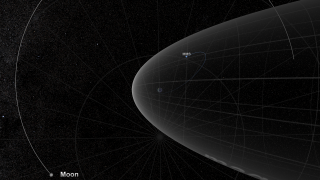
lro_orbit_still.1160.tif
lro_orbit_still.1160_web.png
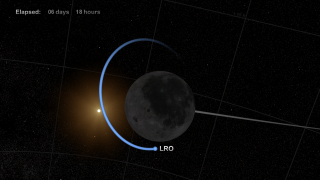
Completed:
2009-04-27
ID Number:
3612
lro_orbit_still.2140.tif
lro_orbit_still.2140_web.png
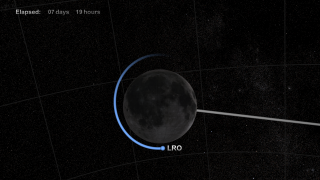
Completed:
2009-04-27
ID Number:
3612
lro_orbit_still.2795.tif
lro_orbit_still.2795_web.png
Completed:
2009-04-27
ID Number:
3612
lro_orbit_still.3810.tif
lro_orbit_still.3810_web.png
Completed:
2009-04-27
ID Number:
3612
lro_orbit_still.5550.tif
lro_orbit_still.5550_web.png
Completed:
2009-04-27
ID Number:
3612
lro_orbit_still.6905.tif
lro_orbit_still.6905_web.png
Completed:
2009-04-27
ID Number:
3612
lro_orbit_still.7950.tif
lro_orbit_still.7950_web.png
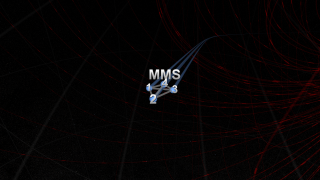
Completed:
2009-04-27
ID Number:
3606
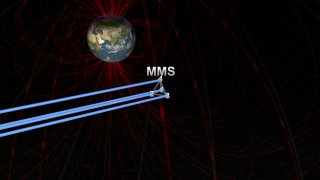
mms_nightside_STILL_noLabel.0001.tif
mms_nightside_STILL.0001.tif
mms_nightside_STILL_noLabel.0001_web.png
Completed:
2009-04-27
ID Number:
3606
mms_nightside_STILL.0800.tif
mms_nightside_STILL_noLabel.0800.tif
mms_nightside_STILL_noLabel.0800_web.png
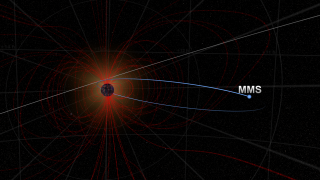
Completed:
2009-04-27
ID Number:
3606
mms_nightside_STILL_noLabel.1100.tif
mms_nightside_STILL.1100.tif
mms_nightside_STILL_noLabel.1100_web.png
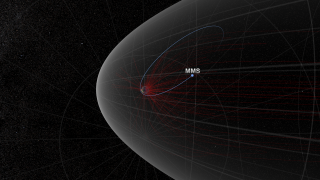
Completed:
2009-04-27
ID Number:
3606
mms_nightside_STILL_noLabel.2400.tif
mms_nightside_STILL.2400.tif
mms_nightside_STILL_noLabel.2400_web.png
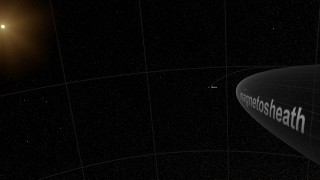
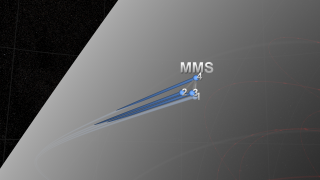
Completed:
2009-04-27
ID Number:
3605
mms_dayside_STILL_noLabel.0001.tif
mms_dayside_STILL.0001.tif
mms_dayside_STILL_noLabel.0001_web.png
Completed:
2009-04-27
ID Number:
3605
mms_dayside_STILL_noLabel.0700.tif
mms_dayside_STILL.0700.tif
mms_dayside_STILL_noLabel.0700_web.png
Completed:
2009-04-27
ID Number:
3605
mms_dayside_STILL_noLabels.1800.tif
mms_dayside_STILL.1800.tif
mms_dayside_STILL_noLabels.1800_web.png
Completed:
2009-04-27
ID Number:
3605
mms_dayside_STILL_noLabels.2600.tif
mms_dayside_STILL.2600.tif
mms_dayside_STILL_noLabels.2600_web.png
Completed:
2009-04-27
ID Number:
3605
mms_dayside_STILL_noLabels.4600.tif
mms_dayside_STILL.4600.tif
mms_dayside_STILL_noLabels.4600_web.png
Completed:
2009-04-27
ID Number:
3605
mms_dayside_STILL_noLabels.5100.tif
mms_dayside_STILL.5100.tif
mms_dayside_STILL_noLabels.5100_web.png
Completed:
2009-04-27
ID Number:
3605
mms_dayside_STILL.6300.tif
mms_dayside_STILL_noLabel.6300.tif
mms_dayside_STILL_noLabel.6300_web.png
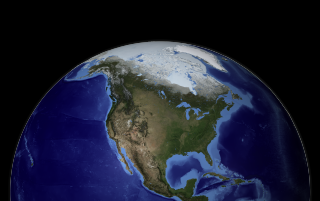
Completed:
2009-05-30
ID Number:
3602
Earth_ice_2008_05_28_final.1185.tif
Earth_ice_2008_05_28_final.1185_web.png
Earth_ice_2008_05_28_final.1185_gal.png
Earth_ice_2008_05_28_final.1185_thm.png
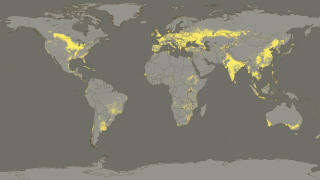
Completed:
2009-06-19
ID Number:
3601
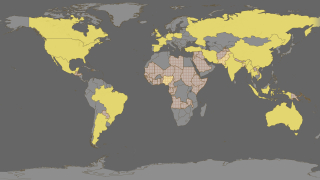
MODISCroplands.0001.tif
MODISCroplands.0001_web.png
Completed:
2009-06-19
ID Number:
3601
LargestProducers.0468.tif
LargestProducers.0468_web.png
Completed:
2009-06-19
ID Number:
3601
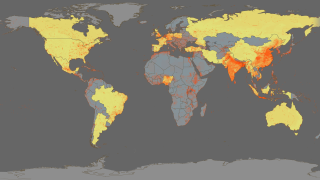
PopulationDensity.0725.tif
PopulationDensity.0725_web.png
Completed:
2009-06-19
ID Number:
3601
Projected2050Population.1228.tif
Projected2050Population.1228_web.png
Completed:
2009-06-19
ID Number:
3601
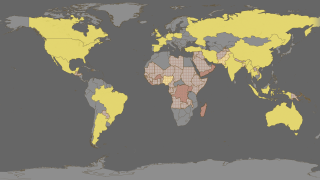
DoublePopulation.1228.tif
DoublePopulation.1228_web.png
Completed:
2009-06-19
ID Number:
3601
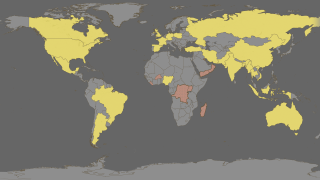
triplepop.1228.tif
triplepop.1228_web.png
Completed:
2009-06-19
ID Number:
3601
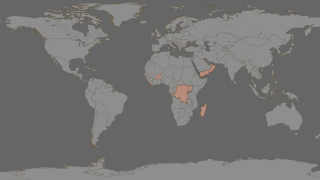
justtriplepop.1228.tif
justtriplepop.1228_web.png
Completed:
2009-06-19
ID Number:
3598
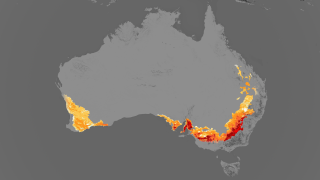
Oct2006_AustraliaNDVIanomalyWheat.2100.tif
Oct2006_AustraliaNDVIanomalyWheat.2100_web.png
Oct2006_AustraliaNDVIanomalyWheat.2100_gal.png
Oct2006_AustraliaNDVIanomalyWheat.2100_thm.png
frames/1280x720_16x9_60p/GrowingSeasonApr_Nov/
NDVIwheat.mp4
NDVIwheat.m4v
frames/1280x720_16x9_30p/
Completed:
2009-06-19
ID Number:
3598
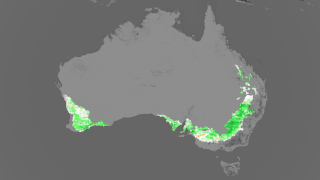
Oct2005_AustraliaNDVIanomalyWheat.1405.tif
Oct2005_AustraliaNDVIanomalyWheat.1405_web.png
Completed:
2009-06-19
ID Number:
3598
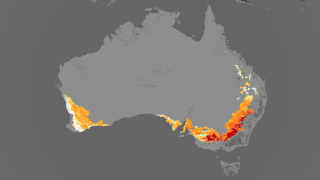
Oct2002_AustraliaNDVIanomalyWheat.0712.tif
Oct2002_AustraliaNDVIanomalyWheat.0712_web.png
Completed:
2009-06-19
ID Number:
3598
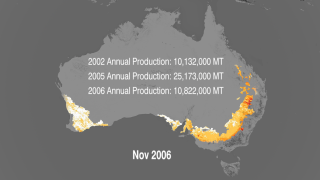
Nov2006_AustraliaNDVIanomalyWheat.2233.tif
Nov2006_AustraliaNDVIanomalyWheat.2233_web.png
Completed:
2009-06-19
ID Number:
3598
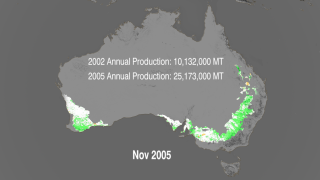
Nov2005_AustraliaNDVIanomalyWheat.0997.tif
Nov2005_AustraliaNDVIanomalyWheat.0997_web.png
Completed:
2009-06-19
ID Number:
3598
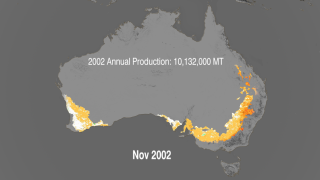
Nov2002_AustraliaNDVIanomalyWheat.0800.tif
Nov2002_AustraliaNDVIanomalyWheat.0800_web.png
Completed:
2009-06-01
ID Number:
3597
firesOriginloopsparta1280x720_30.mp4
firesOriginloop512x288_30.mpg
frames/1280x720_16x9_30p/
frames/1280x720_16x9_60p/
firesOriginloop.1400_web.png
firesOriginloop.1400_gal.png
firesOriginloop.1400_thm.png
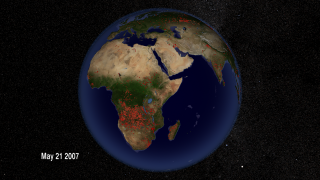
May252007Fires.1440.tif
frames/1280x720_16x9_30p/
Fires2007.m4v
Completed:
2009-06-01
ID Number:
3597
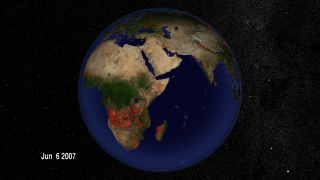
June072007FIres.1562.tif
June072007FIres.1562_web.png
Completed:
2009-04-21
ID Number:
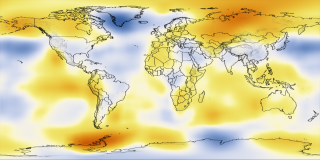
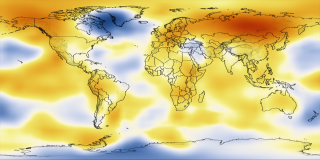
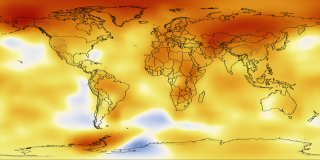
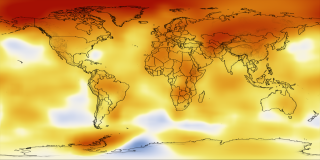
3596
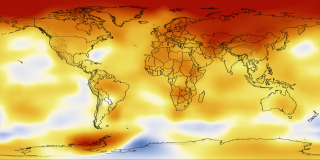
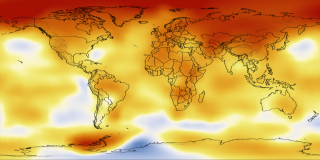
StillImages.2004.tif
StillImages.2004_web.png
StillImages.2004_gal.png
StillImages.2004_thm.png
frames/2048x1024_2x1_15p/
GISStemperatureDifference1881_2008at15fps.m4v
GCMtemperatureDates512x288_30.mpg
frames/1280x720_16x9_30p/
GCMyearly.m4v
GCMyearlydates.mp4
frames/1280x720_16x9_30p/
Completed:
2009-04-21
ID Number:
3596
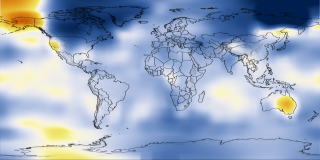
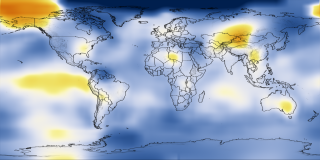
StillImages.1881.tif
StillImages.1881_web.png
Completed:
2009-04-21
ID Number:
3596
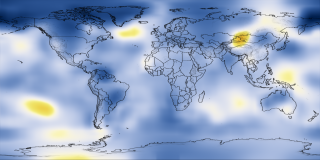
StillImages.1891.tif
StillImages.1891_web.png
Completed:
2009-04-21
ID Number:
3596
StillImages.1901.tif
StillImages.1901_web.png
Completed:
2009-04-21
ID Number:
3596
StillImages.1911.tif
StillImages.1911_web.png
Completed:
2009-04-21
ID Number:
3596
StillImages.1921.tif
StillImages.1921_web.png
Completed:
2009-04-21
ID Number:
3596
StillImages.1931.tif
StillImages.1931_web.png
Completed:
2009-04-21
ID Number:
3596
StillImages.1941.tif
StillImages.1941_web.png
Completed:
2009-04-21
ID Number:
3596
StillImages.1951.tif
StillImages.1951_web.png
Completed:
2009-04-21
ID Number:
3596
StillImages.1961.tif
StillImages.1961_web.png
Completed:
2009-04-21
ID Number:
3596
StillImages.1971.tif
StillImages.1971_web.png
Completed:
2009-04-21
ID Number:
3596
StillImages.1981.tif
StillImages.1981_web.png
Completed:
2009-04-21
ID Number:
3596
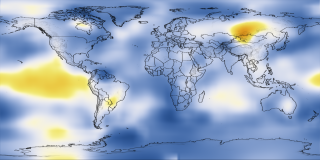
StillImages.1991.tif
StillImages.1991_web.png
Completed:
2009-04-21
ID Number:
3596
StillImages.2001.tif
StillImages.2001_web.png
Completed:
2009-04-21
ID Number:
3596
StillImages.2002.tif
StillImages.2002_web.png
Completed:
2009-04-21
ID Number:
3596
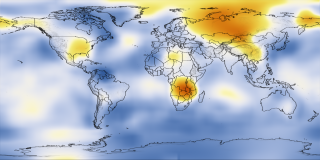
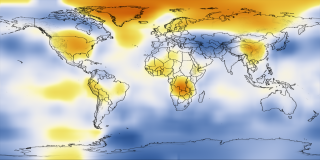
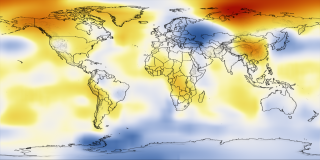
StillImages.2003.tif
StillImages.2003_web.png
Completed:
2009-07-27
ID Number:
3595
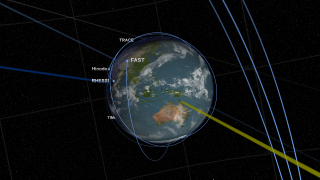
sentinels_STILL.00001.tif
sentinels_STILL.00001_web.png
Completed:
2009-07-27
ID Number:
3595
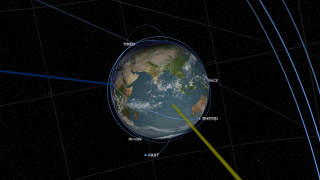
sentinels_STILL.00780.tif
sentinels_STILL.00780_web.png
Completed:
2009-07-27
ID Number:
3595
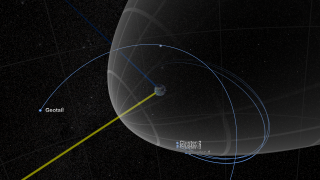
sentinels_STILL.01440.tif
sentinels_STILL.01440_web.png
sentinels_STILL.01440_gal.png
Completed:
2009-07-27
ID Number:
3595
sentinels_STILL.02334.tif
sentinels_STILL.02334_web.png
Completed:
2009-07-27
ID Number:
3595
sentinels_STILL.02800.tif
sentinels_STILL.02800_web.png
Completed:
2009-07-27
ID Number:
3595
sentinels_STILL.04600.tif
sentinels_STILL.04600_web.png
+ Privacy Policy and Important Notices
+ Reproduction Guidelines
NASA Official:
SVS Contact:
Curator:


