Data & Statistics
In the United States
- 4.5 million children 5-17 years of age have ever been diagnosed with ADHD as of 2006. [Read article]
- 3%-7% of school-aged children suffer from ADHD. Some studies have estimated higher rates in community samples.1
- 7.8% of school-aged children were reported to have an ADHD diagnosis by their parent in 2003. [Read article]
- Diagnosis of ADHD increased an average of 3% per year from 1997 to 2006. [Read article]
- Boys (9.5%) are more likely than girls (5.9%) to have been diagnosed with ADHD. [Read article]
- ADHD diagnosis is significantly higher among non-Hispanic, primarily English-speaking, and insured children. [Read article]
- Prevalence rates are significantly higher for children in families in which the most highly educated adult was a high school graduate (or had completed 12 years of education), compared with children in families in which the most highly educated adult had a higher or lower level of education. [Read article]
- ADHD diagnosis among males was reported significantly more often in families with incomes below the poverty threshold (<100%) than in families with incomes at or above the poverty threshold. Rates of reported diagnosis among females were not significantly different across the three levels of poverty. [Read article]
- Prevalence varies substantially by state, from a low of 5% in Colorado to a high of 11.1% in Alabama. [Read article]
State-based Prevalence Data of ADHD Diagnosis

Medication Treatment
[Read article]
- As of 2003, 2.5 million youth ages 4-17 years (56% of those with a diagnosis) were receiving medication treatment for the disorder.
- Rates of medication treatment for ADHD vary by age and sex and ranged from .3% to 9.3%.
- Prevalence of medication treatment for ADHD is highest among children aged 9-12 years.
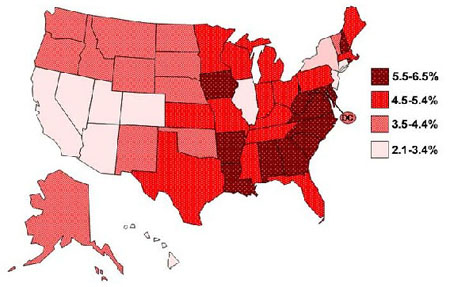
- Geographic variability in prevalence of medication treatment ranged from a low of 2.1% in California to a high of 6.5% in Arkansas.
State-based Prevalence Data of ADHD Medication Treatment
Diagnosed Attention Deficit Hyperactivity Disorder and Learning Disability: United States, 2004-2006:
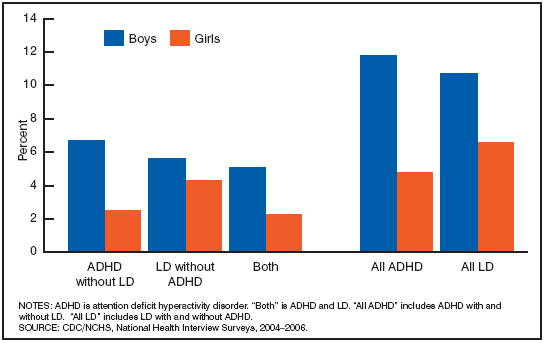
- About 5% of children had ADHD without Learning Disability (LD), 5% had LD without ADHD, and 4% had both conditions.
- Children 12-17 years of age were more likely than children 6-11 years of age to have each of the diagnoses.
- Hispanic children were less likely than non-Hispanic white and non-Hispanic black children to have ADHD (with and without LD).
- Children with Medicaid were more likely than uninsured children or privately insured children to have each of the diagnoses.
- Children with each of the diagnoses were more likely than children with neither ADHD nor LD to have other chronic health conditions.
- Children with ADHD (with and without LD) were more likely than children without ADHD to have contact with a mental health professional, use prescription medication, and have frequent health care visits.
Peer Relationships
- Parents of children with a history of ADHD report almost 3 times as many peer problems as those without a history of ADHD (21.1% vs. 7.3%).
- Parents report that children with a history of ADHD are almost 10 times as likely to have difficulties that interfere with friendships (20.6% vs. 2.0%).
Injury
- A higher percentage of parents of children with attention-deficit/hyperactivity disorder reported non-fatal injuries (4.5% vs. 2.5% for healthy children). [Read article]
- Children with ADHD, compared to children without ADHD, were more likely to have major injuries (59% vs. 49%), hospital inpatient (26% vs. 18%), hospital outpatient (41% vs. 33%), or emergency department admission (81% vs. 74%). [Read article]
- Data from international samples suggest that young people with high levels of attentional difficulties are at greater risk of involvement in a motor vehicle crash, drinking and driving, and traffic violations. [Read article]
Economic Cost
- Using a prevalence rate of 5%, the annual societal ‘‘cost of illness’’ for ADHD is estimated to be between $36 and $52 billion, in 2005 dollars. It is estimated to be between $12,005 and $17,458 annually per individual. [Read article]
- There were an estimated 7 million ambulatory care visits for ADHD in 2006. [Read article]
- The total excess cost of ADHD in the US in 2000 was $31.6 billion. Of this total, $1.6 billion was for the treatment of patients, $12.1 billion was for all other healthcare costs of persons with ADHD, $14.2 billion was for all other healthcare costs of family members with ADHD, and $3.7 billion was for the work loss cost of adults with ADHD and adult family members of persons with ADHD. [Read article]
- ADHD creates a significant financial burden regarding the cost of medical care and work loss for patients and family members. The annual average direct cost for each per ADHD patient was $1,574, compared to $541 among matched controls. The annual average payment (direct plus indirect cost) per family member was $2,728 for non-ADHD family members of ADHD patients versus $1,440 for family members of matched controls. [Read article]
- Across 10 countries, it was projected that ADHD was associated with 143.8 million lost days of productivity each year. Most of this loss can be attributed to ADHD and not co-occurring conditions. [Read article]
- Workers with ADHD were more likely to have at least one sick day in the past month compared to workers without ADHD. [Read article]
Footnotes:
[1] American Psychiatric Association. Diagnostic and Statistical Manual of Mental Disorders: DSM-IV-TR. Washington: American Psychiatric Association, 2000.
Contact Us:
- Centers for Disease Control and Prevention
- National Center on Birth Defects and Developmental Disabilities
- Division of Human Development and Disabilities
- 1600 Clifton Road
- MS E-86
- Atlanta, GA 30333
- 800-CDC-INFO
(800-232-4636)
TTY: (888) 232-6348
24 Hours/Every Day - cdcinfo@cdc.gov
