MODIS Sea Surface Temperature from 2002 to 2006
|
|
A recent study indicates there is a correlation between ocean nutrients and changes in sea surface temperature (SST). The results show that when ocean water warms, marine plant life in the form of microscopic phytoplankton tend to decline. When water cools, plant life flourishes. Changes in phytoplankton growth influence fishery yields and the amount of carbon dioxide the oceans remove from the atmosphere. This could have major implications on the future of our ocean's food web and how it relates to climate change. The temperature data in this visualization comes from the Moderate Resolution Imaging Spectroradiometer (MODIS) onboard NASA's Terra and Aqua spacecraft. In order to see the correlation between SST and SeaWiFS data, this animation can be compared to the latter part of the animation called 'SeaWiFS Biosphere from 1997 to 2006'. Please click here to see this other animation.
|
|

|
|
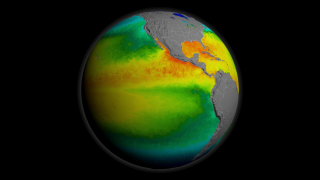
This animation shows a 32-day moving average of SST data over the Pacific spanning July 4, 2002 to October 23, 2006.
Duration: 24.0 seconds
Available formats:
1280x720 (59.94 fps)
Frames
1280x720 (59.94 fps)
MPEG-2
52 MB
640x480 (29.97 fps)
MPEG-1
4 MB
320x240 (29.97 fps)
MPEG-1
1 MB
720x480 (29.97 fps)
MPEG-2
5 MB
640x480 (29.97 fps)
MPEG-4
4 MB
1280x720 (29.97 fps)
MPEG-4
8 MB
320x180
PNG
32 KB
160x80
PNG
9 KB
80x40
PNG
3 KB
1024x512
Frames
(Cartesian)
2048x1024
Frames
(Cartesian)
320x240 (29.97 fps)
X-FLV
397 KB
720x486 (29.97 fps)
Frames
How to play our movies
|
|
This product is available through our Web Map Service.
Click here to learn more.
|
|
|
|
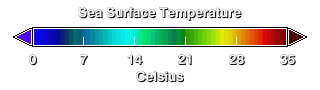
Sea Surface Temperature in Degrees Celsius.
Available formats:
320 x 90
PNG
9 KB
|
|

|
|
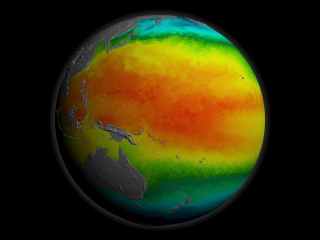
A 32-day average of SST data over the Pacific Ocean averaged over September 22, 2006 to October 23, 2006.
Available formats:
2560 x 1920
TIFF
2 MB
320 x 240
PNG
51 KB
|
|
|
Back to Top
|

