

Images & Animations
-
Credit
NASA/Goddard Space Flight Center Scientific Visualization Studio
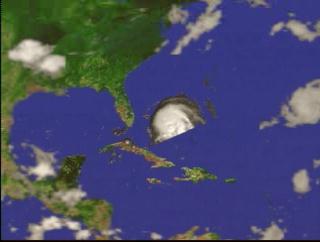
Hurricane Dennis from TRMM: August 27, 1999 (slower)
A fly-in to Hurricane Dennis on August 27, 1999, showing the three-dimensional structure of the precipitation as measured by the Precipitation Radar instrument on TRMM. In this animation, a surface of constant precipitation is colored by the value of the precipitation on the ground under the surface. The global cloud cover data was measured by GOES.
Metadata
-
Sensor
TRMM/VIRS, TRMM/PR, TRMM/TMI -
Animation ID
722 -
Video ID
SVS1999-0021 -
Start Timecode
01:02:09:00 -
End Timecode
01:05:15:12 -
Animator
Greg Shirah, Tom Bridgman -
Studio
SVS -
Visualization Date
1999/08/27 -
Scientist
Chris Kummerow (NASA/GSFC) -
Keywords
Hurricane -
DLESE Subject
Natural hazards, Atmospheric science -
Data Date
1999/08/27 -
Animation Type
Regular