| 2008 | Title Formats Available |
|---|---|
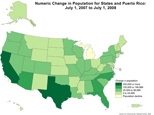 |
Numeric Change in Population for States and Puerto Rico: July 1, 2007 to July 1, 2008 |
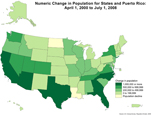 |
Numeric Change in Population for States and Puerto Rico: April 1, 2000 to July 1, 2008 |
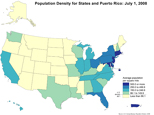 |
Population Density for States and Puerto Rico: 2008 |
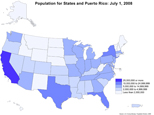 |
Population for States and Puerto Rico: 2008 |
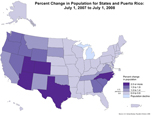 |
Percent Change in Population for States and Puerto Rico: July 1, 2007 to July 1, 2008 |
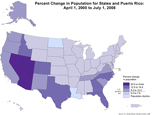 |
Percent Change in Population for States and Puerto Rico: April 1, 2000 to July 1, 2008 |
Data table associated with these maps [XLS (26k)] [CSV (6k)] |
|
| 2008 | Title Formats Available |
|---|---|
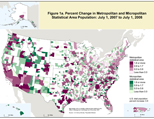 |
Figure 1a. Percent Change in Metropolitan and Micropolitan Statistical Area Population: July 1, 2007 to July 1, 2008 |
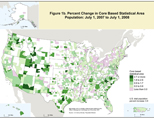 |
Figure 1b. Percent Change in Core Based Statistical Area Population: July 1, 2007 to July 1, 2008 |
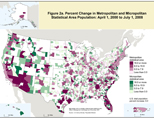 |
Figure 2a. Percent Change in Metropolitan and Micropolitan Statistical Area Population: April 1, 2000 to July 1, 2008 |
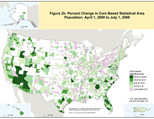 |
Figure 2b. Percent Change in Core Based Statistical Area Population: April 1, 2000 to July 1, 2008 |
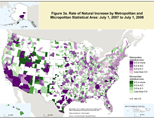 |
Figure 3a. Rate of Natural Increase by Metropolitan and Micropolitan Statistical Area: July 1, 2007 to July 1, 2008 |
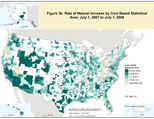 |
Figure 3b. Rate of Natural Increase by Core Based Statistical Area: July 1, 2007 to July 1, 2008 |
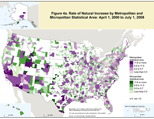 |
Figure 4a. Rate of Natural Increase by Metropolitan and Micropolitan Statistical Area: April 1, 2000 to July 1, 2008 |
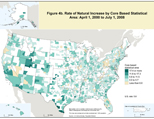 |
Figure 4b. Rate of Natural Increase by Core Based Statistical Area: April 1, 2000 to July 1, 2008 |
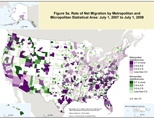 |
Figure 5a. Rate of Net Migration by Metropolitan and Micropolitan Statistical Area: July 1, 2007 to July 1, 2008 |
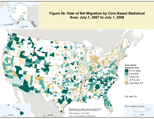 |
Figure 5b. Rate of Net Migration by Core Based Statistical Area: July 1, 2007 to July 1, 2008 |
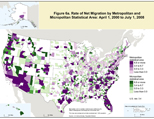 |
Figure 6a. Rate of Net Migration by Metropolitan and Micropolitan Statistical Area: April 1, 2000 to July 1, 2008 |
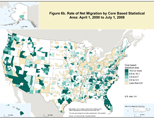 |
Figure 6b. Rate of Net Migration by Core Based Statistical Area: April 1, 2000 to July 1, 2008 |
| Download the table associated with this map [XLS (185k)] [CSV (101k)] | |
| 2008 | Title Formats Available |
|---|---|
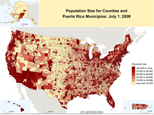 |
Population Size for Counties and Puerto Rico Municipios: July 1, 2008 |
 |
Population Density for Counties and Puerto Rico Municipios: July 1, 2008 |
 |
Numeric Change in Population for Counties and Puerto Rico Municipios: July 1, 2007 to July 1, 2008 |
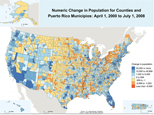 |
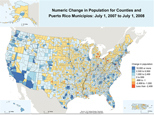
Numeric Change in Population for Counties and Puerto Rico Municipios: April 1, 2000 to July 1, 2008 |
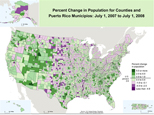 |
Percent Change in Population for Counties and Puerto Rico Municipios: July 1, 2007 to July 1, 2008 |
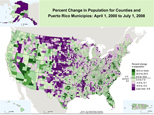 |
Percent Change in Population for Counties and Puerto Rico Municipios: April 1, 2000 to July 1, 2008 |
Download the table associated with this map [XLS (641k)] [CSV (261k)] |
|