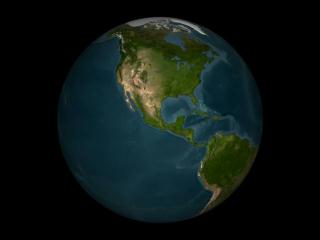
AURA/OMI Tropospheric Ozone over South America
|
Aura's instruments study tropospheric, or low-level atmospheric chemistry. Many different organizations monitor regional areas of the troposphere, but Aura is the first to record daily global measurements.
|
|

|
|
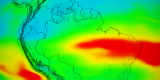
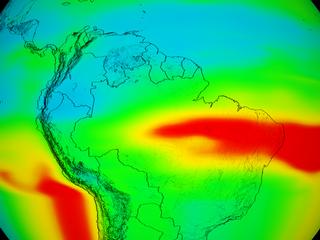
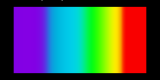
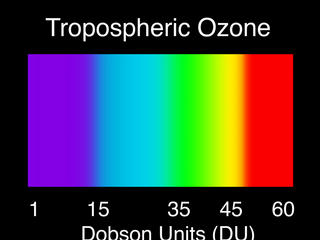
This animation shows how ozone in the Troposphere changes from September 28, 2004 to November 6, 2004. Areas of Red represent high levels (50+ DU) and areas of blue represent low areas (20 DU).
Duration: 18.0 seconds
Available formats:
640x480 (29.97 fps)
MPEG-1
7 MB
320x240 (29.97 fps)
MPEG-1
3 MB
320x240
JPEG
5 KB
320x240
JPEG
5 KB
How to play our movies
|
|

|
|
October 12, 2004
Available formats:
2560 x 1920
TIFF
4 MB
160 x 80
PNG
19 KB
320 x 240
JPEG
10 KB
80 x 40
PNG
6 KB
|
|

|
|
Tropospheric Ozone Colorbar
Available formats:
2560 x 1920
TIFF
1 MB
160 x 80
PNG
1 KB
320 x 240
JPEG
10 KB
|
|
|
Back to Top
|

